. 2013 Jun:73:50-8.
doi: 10.1016/j.neuroimage.2013.01.071. Epub 2013 Feb 8.

Describing functional diversity of brain regions and brain networks

Affiliations

Describing functional diversity of brain regions and brain networks

Michael L Anderson et al. Neuroimage. 2013 Jun.

Abstract

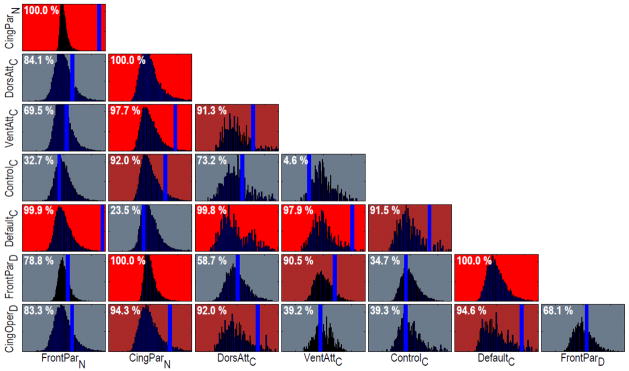
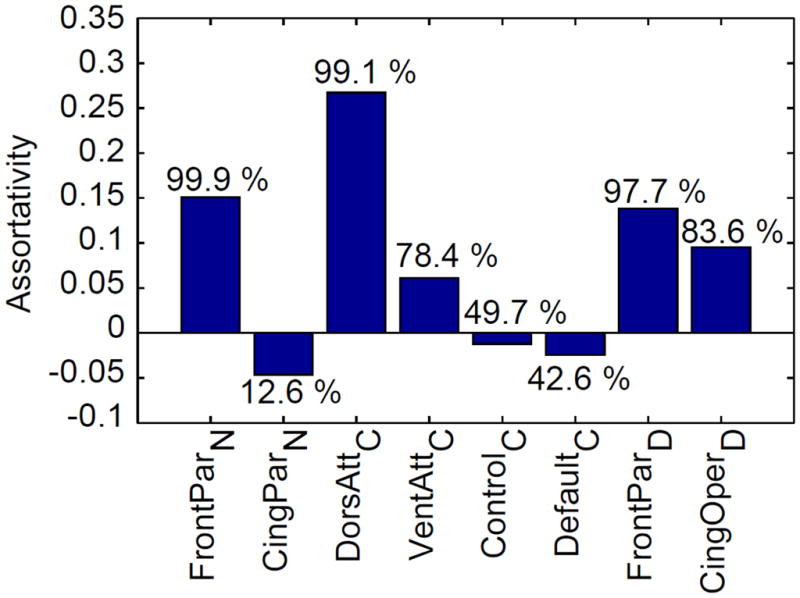
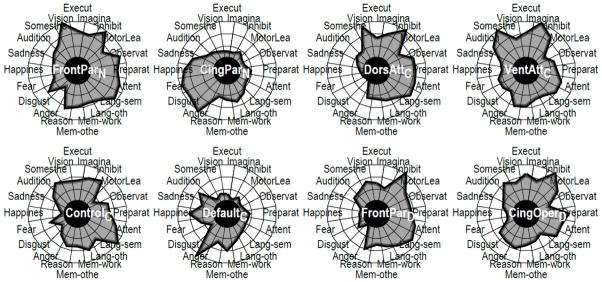
Despite the general acceptance that functional specialization plays an important role in brain function, there is little consensus about its extent in the brain. We sought to advance the understanding of this question by employing a data-driven approach that capitalizes on the existence of large databases of neuroimaging data. We quantified the diversity of activation in brain regions as a way to characterize the degree of functional specialization. To do so, brain activations were classified in terms of task domains, such as vision, attention, and language, which determined a region's functional fingerprint. We found that the degree of diversity varied considerably across the brain. We also quantified novel properties of regions and of networks that inform our understanding of several task-positive and task-negative networks described in the literature, including defining functional fingerprints for entire networks and measuring their functional assortativity, namely the degree to which they are composed of regions with similar functional fingerprints. Our results demonstrate that some brain networks exhibit strong assortativity, whereas other networks consist of relatively heterogeneous parts. In sum, rather than characterizing the contributions of individual brain regions using task-based functional attributions, we instead quantified their dispositional tendencies, and related those to each region's affiliative properties in both task-positive and task-negative contexts.


Figures

Figure 1
Figure 1
Determination of functional fingerprints. To illustrate the process, only three task domains are shown. The actual fingerprints used in the paper were 20-dimensional. The label “regional” refers to voxels in cortex (via the searchlight), subcortical regions, or networks. The final normalization step ensures that the fingerprint values all sum to 1.
Figure 2
Figure 2
Diversity profiles. The polar plots illustrate the diversity profile of two brain regions, the dorsal anterior cingulate cortex (ACC) and the right anterior insula (AI). Each plot was scaled separately. Each vertex corresponds to one of the domains investigated. See Table S1 for coordinates from the original study by Dosenbach and collegues (2007) and Methods for full description of domains. The green line is the observed fingerprint. The red and blue lines indicate the upper and lower values of the estimates for each domain (see Methods). This range is provided to give an idea of variability, but should not be interpreted directly. Because of normalization (proportions sum to 1), a very high proportion in one domain will imply that other proportions need to be reduced; in other words, the values are not independent of each other.
Figure 3
Figure 3
Functional diversity map. (A) Areas of higher diversity are shown in warm colors and areas of lower diversity are shown in cool colors (color bar represents Shannon entropy values). Locations without colors did not have enough studies for the estimation of diversity. (B) Same as in part A, but masked so as to show only the locations where diversity was estimated with greater confidence. This was the case when the variability in Shannon diversity was less than 10% (specifically, the highest density interval did not exceed .3).
Figure 4
Figure 4
Subcortical diversity. Color scale and range as in Figure 3. For the dentate nucleus and hippocampus, the right and left hemispheres were pooled so as to yield enough observations for the determination of functional diversity. L, left; R, right.
Figure 5
Figure 5
Network comparison. A multivariate comparison with permutation testing was used to compare pairs of networks. The distributions portray the null distribution of possible differences between each pair. The blue vertical bars indicate the observed difference, which is shown on top of each box in terms of its percentile relative to the null distribution (when not shown, the bar was located to the right of the displayed area). For illustration, comparisons with percentiles > 95% are shown in red and comparisons with percentiles > 90% are shown in magenta. For example: FrontoParietalN and CinguloParietalN were very different, DorsalAttentionC and VentralAttentionC were distinct but to a lesser extent, and CinguloParietalN and DefaultC were similar.
Figure 6
Figure 6
Network assortativity. Assortativity measures the extent to which functional fingerprints from regions of the same network are more similar to each other than to fingerprints from other networks. The percentile scores provide an indication of the degree of assortativity (or dis-assortativity in the case of CinguloParietalN)
Figure 7
Figure 7
Network functional fingerprints.

Similar articles

Cited by

References

    1. Anderson ML. Neural reuse: a fundamental organizational principle of the brain. Behavioral and Brain Sciences. 2010;33(4):245–266. doi: 10.1017/s0140525×10000853. discussion 266–313. - DOI - PubMed
    1. Andrews-Hanna JR, Reidler JS, Sepulcre J, Poulin R, Buckner RL. Functional-anatomic fractionation of the brain’s default network. Neuron. 2010;65(4):550–562. doi: 10.1016/j.neuron.2010.02.005. - DOI - PMC - PubMed
    1. Aslan B, Zech G. New test for the multivariate two-sample problem based on the concept of minimum energy. Journal of Statistical Computation and Simulation. 2005;75(2):109–119.
    1. Bressler SL, Menon V. Large-scale brain networks in cognition: emerging methods and principles. Trends in cognitive sciences. 2010;14(6):277–290. - PubMed
    1. Burley N. The meaning of assortative mating. Ethology and Sociobiology. 1983;4(4):191–203.

LinkOut - more resources