. 2013 Mar;19(3):305-12.
doi: 10.1038/nm.3079. Epub 2013 Feb 10.

Noncanonical EF-hand motif strategically delays Ca2+ buffering to enhance cardiac performance

Affiliations

Noncanonical EF-hand motif strategically delays Ca2+ buffering to enhance cardiac performance

Wang Wang et al. Nat Med. 2013 Mar.

Abstract

EF-hand proteins are ubiquitous in cell signaling. Parvalbumin (Parv), the archetypal EF-hand protein, is a high-affinity Ca(2+) buffer in many biological systems. Given the centrality of Ca(2+) signaling in health and disease, EF-hand motifs designed to have new biological activities may have widespread utility. Here, an EF-hand motif substitution that had been presumed to destroy EF-hand function, that of glutamine for glutamate at position 12 of the second cation binding loop domain of Parv (ParvE101Q), markedly inverted relative cation affinities: Mg(2+) affinity increased, whereas Ca(2+) affinity decreased, forming a new ultra-delayed Ca(2+) buffer with favorable properties for promoting cardiac relaxation. In therapeutic testing, expression of ParvE101Q fully reversed the severe myocyte intrinsic contractile defect inherent to expression of native Parv and corrected abnormal myocardial relaxation in diastolic dysfunction disease models in vitro and in vivo. Strategic design of new EF-hand motif domains to modulate intracellular Ca(2+) signaling could benefit many biological systems with abnormal Ca(2+) handling, including the diseased heart.


Conflict of interest statement

COMPETING FINANCIAL INTERESTS

The authors declare no competing financial interests.

Figures
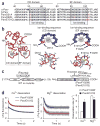
Figure 1
Figure 1
EF-hand motif design and biochemical kinetic analysis. (a) Sequence alignment of the two EF-hand Ca2+ binding domains (the CD and EF domains) of human α-Parv (WT), carp β-Parv (WT) and Parv variants. The 12-amino-acid metal-binding sequences are highlighted in boxes, and the substitutions are shown in red. (b) Two- and three-dimensional diagrams of the CD and EF domains of ParvE101Q (containing the D51A. E101Q and F102W substitutions). Broken lines in the loop domains (top) indicate interaction between the six coordinating residues and Ca2+. (c) Schematic of the adenovirus vector–expressing Parv constructs driven by a cytomegalovirus (CMV) promoter and a prokaryotic expression vector containing a GST tag system for Parv protein purification from Escherichia coli. The thrombin recognition site between the GST tag and Parv facilitates the removal of the GST tag during protein purification. The resultant Parv protein has two additional residues at its N terminus. ITR, inverted terminal repeat; aa, amino acids. (d) Representative traces and summarized data of the Ca2+ and Mg2+ dissociation rates of ParvF102W and ParvE101Q. ΔTrp fluorescence, change in tryptophan fluorescence. Data are shown as the means ± s.e.m. n = 16–41 experiments. *P < 0.01 compared to ParvF102W by unpaired t test.
Figure 2
Figure 2
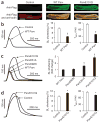
Functional screening of Parv motifs in rat adult cardiac myocytes. (a) Immunofluorescence images showing ParvE101Q expression in adult rat cardiac myocytes 72 h after gene transfer. Red, actin-specific antibody; green, Flag-specific antibody; blue, nuclear staining with DAPI; control, untreated. Scale bars, 20 μm. (b) Representative sarcomere length (SL) traces, summarized sarcomere length shortening and the cell relaxation parameter (T50%) of untreated (control) and WT Parv–expressing myocytes 72 h after gene transfer. Data are shown as the means ± s.e.m. n = 39–43 cells from 3–4 rats. P < 0.001 compared to controls. (c) Representative sarcomere length traces and summarized sarcomere length shortening (fold change compared to WT Parv) comparing the effects of WT Parv and the indicated Parv variants. Data are shown as the means ± s.e.m. n = 43–51 cells from 3–4 rats. P < 0.001 compared to WT Parv. (d) Representative sarcomere length traces, summarized sarcomere length shortening and the cell relaxation parameter (T50%) of control and ParvE101Q-expressing myocytes 72 h after gene transfer. The experimental temperature was 29 °C. Data are shown as the means ± s.e.m. n = 39–48 cells from 3–4 rats. *P < 0.01 compared to controls.
Figure 3
Figure 3
Effects of ParvE101Q on rabbit adult cardiac myocyte contractility and relaxation. (a,b) Expression of WT β-Parv (WT Parv) and ParvE101Q in rabbit cardiac myocytes 24–96 h after gene transfer as determined by western blot (a) and immunofluorescence assay (b). Red, actin-specific antibody; green, Flag-specific antibody; blue, nuclear staining with DAPI. Scale bars: top, 200 μm; bottom, 20 μm. (c,d) Representative original (c) and normalized (d) traces of sarcomere length (SL) shortening from an untreated (control) myocyte and a myocyte with ParvE101Q gene transfer for 72 h. The experimental temperature was 29 °C. (e,f) Summarized data showing the effects of ParvE101Q on sarcomere length shortening (e) and relaxation (T50%; f) at the indicated times after gene transfer. Data are shown as the means ± s.e.m. n = 28–69 cells from 3–5 rabbits. P < 0.001 compared to controls by two-way analysis of variance (ANOVA). (g,h) Summarized data showing the effects of ParvE101Q on sarcomere length shortening (g) and relaxation (T50%; h) 48 h after gene transfer and at the indicated pacing frequencies. Data are shown as the means ± s.e.m. n = 43–63 cells from 4 rabbits. P < 0.001 compared to controls by two-way ANOVA.
Figure 4
Figure 4
Effects of ParvE101Q on Ca2+ handling and myofilaments. (a) Representative Ca2+ transient traces (left), summarized data on Ca2+ transient amplitude (middle) and time from peak to 25% (T25%) or 75% (T75%) decay (right) of untreated (control) and ParvE101Q-expressing rabbit adult cardiac myocytes. 360/380, the ratio of emitted Fura-2 fluorescence at 360 nm and 380 nm excitations. Data are shown as the means ± s.e.m. n = 43–46 cells from 3–4 rabbits. P < 0.001 compared to controls. (b) Representative traces (left) and summarized data showing the effects of ParvE101Q on the amplitude (sarcoplasmic reticulum (SR) Ca2+ store; middle) and decay (T75% caffeine decay; right) of caffeine-induced sarcoplasmic reticulum Ca2+ transient 72 h after gene transfer. The experimental temperature was 29 °C. Data are shown as the means ± s.e.m. n = 25 cells from 3 rabbits. (c) Representative sarcomere length (SL) traces (left and middle) and summarized data (right) showing the effects of co-transferring cTnC L29Q and ParvE101Q on the contractility of rat adult myocytes 72 h after gene transfer. +ParvE101Q is treatment with ParvE101Q;-ParvE101Q is no treatment. Data are shown as the means ± s.e.m. n = 38–41 cells from 4 rats. *P < 0.05 compared to the -ParvE101Q group by one-way ANOVA. The experimental temperature was 37 °C. (d) Summarized data showing myofilament Ca2+ sensitivity (pCa50; left), cooperative molecular interactions along the thin filament (Hill coefficient; middle) or the relative maximum tension (right) before (control) and after incubating permeabilized myocytes with recombinant ParvE101Q (0.05 mM for 10 min). n = 3 separate experiments. Data are shown as the means ± s.e.m.
Figure 5
Figure 5
ParvE101Q rescues depressed contraction and relaxation in failing myocytes and myocytes with induced relaxation defects. (a) Immunofluorescence images showing ParvE101Q expression in cardiac myocytes from a canine heart failure model (HF) 48 h after gene transfer. Red, actin-specific antibody; green, Flag-specific antibody; blue, nuclear staining with DAPI. Scale bars, 20 μm. (b) Summarized data of the effects of ParvE101Q on the prolonged relaxation time course (T50%) of canine failing myocytes at 37 °C. Data are shown as the means ± s.e.m. n = 21–45 cells. *P < 0.05 compared to normal (untreated) cells, #P < 0.05 compared to HF by one-way ANOVA. (c,d) Representative original (c) and normalized (d) sarcomere length (SL) traces of adult cardiac myocytes isolated from heart failure rabbit myocytes (HF; not treated) without or with ParvE101Q gene transfer (HF + ParvE101Q). (e,f) Summarized data showing the effects of ParvE101Q on sarcomere length shortening (e) and relaxation (T50%; f) of cells from HF rabbits 48 h after gene transfer at a pacing frequency of 0.2 Hz. Data are shown as the means ± s.e.m. n = 29–35 cells from 2 rabbits. P < 0.001 compared to the -ParvE101Q group by unpaired t test. (g,h) Representative normalized sarcomere length traces of the effects of ParvE101Q on the slow relaxation induced by thapsigargin (TG, 50 nM; g) and ischemia-reperfusion (I-R) mimetic treatment (h) in rabbit cardiac myocytes at 29 °C. Controls were untreated cells.
Figure 6
Figure 6
Systemic rAAV delivery of ParvE101Q rescues defective relaxation in cardiomyopathy models of cell-intrinsic diastolic dysfunction in vivo. (a) Experimental timeline for study of mice with inducible cardiac myocyte-specific SERCA2a deficiency (mice with a floxed (Fl) ATP2A2 allele and a MerCreMer transgene in which gene deletion was induced by tamoxifen treatment). Echo, echocardiography. (b) Summarized echocardiography data showing the effects of ParvE101Q on in vivo diastolic (relaxation) dysfunction in SERCA2a-deficient mice (KO) (KO + E101Q) in comparison to control SERCA2a floxed (Fl) mice. IVRTc, isovolumic relaxation time corrected by heart rate (square root of the R wave to R wave interval); Tei index, isovolumic contraction time and isovolumic relaxation time divided by the ejection time. Data are shown as the means ± s.e.m. *P < 0.05 compared to Fl, #P < 0.05 compared to KO by one-way ANOVA. n = 2–3 mice. (c) Summary of Millar micromanometry catheterization data for contractility and relaxation performance by ParvE101Q in SERCA2a-deficient mice in vivo. Data are shown as the means ± s.e.m. n = 2–3 mice. *P < 0.05 compared to Fl, #P < 0.05 compared to KO by one-way ANOVA. (d) Experimental protocol using RCM transgenic (Tg) mice with therapeutic α-ParvE101Q gene transfer in vivo. Adult mice were treated with rAAV vectors containing human α-ParvE101Q (RCM + α-ParvE101Q), human α-ParvF102W (as WT Parv; RCM + α-ParvF102W) or saline vehicle (RCM + saline). Ten weeks later, in vivo real time hemodynamics of mice from the three groups and a nontransgenic (Ntg) control group were recorded by pressure-conductance catheterization. LV, left ventricular; P-V, pressure-volume. (e,f) Summary of Millar micromanometry catheterization data for relaxation function, including the peak rate of left ventricular systolic pressure decline (−dP/dt; e) and Tau, a load-independent measure of relaxation (f). Data are shown as the means ± s.e.m. n = 5–15 mice. *P < 0.05 compared to Ntg. F102W, human α-ParvF102W; E101Q, human α-ParvE101Q. (g) Schematic model of the strategic design of the ultra-delayed EF-hand Ca2+ buffer ParvE101Q for optimizing Ca2+ binding during the diastolic phase to accelerate active relaxation while preserving contractility. WT Parv is defective for cardiac application, as it buffers Ca2+ too early in systole to cause blunted Ca2+ amplitude and contraction.

References

    1. Clapham DE. Calcium signaling. Cell. 2007;131:1047–1058. - PubMed
    1. Bers DM. Cardiac excitation-contraction coupling. Nature. 2002;415:198–205. - PubMed
    1. Kaye DM, Hoshijima M, Chien KR. Reversing advanced heart failure by targeting Ca2+ cycling. Annu Rev Med. 2008;59:13–28. - PubMed
    1. Kass DA, Bronzwaer JG, Paulus WJ. What mechanisms underlie diastolic dysfunction in heart failure? Circ Res. 2004;94:1533–1542. - PubMed
    1. Yano M, Ikeda Y, Matsuzaki M. Altered intracellular Ca2+ handling in heart failure. J Clin Invest. 2005;115:556–564. - PMC - PubMed

Publication types

MeSH terms