Review
. 2013 Jul:35:18-43.
doi: 10.1016/j.preteyeres.2013.01.004. Epub 2013 Feb 5.

A proteomics view of the molecular mechanisms and biomarkers of glaucomatous neurodegeneration

Affiliations
Review

A proteomics view of the molecular mechanisms and biomarkers of glaucomatous neurodegeneration

Gülgün Tezel. Prog Retin Eye Res. 2013 Jul.

Abstract

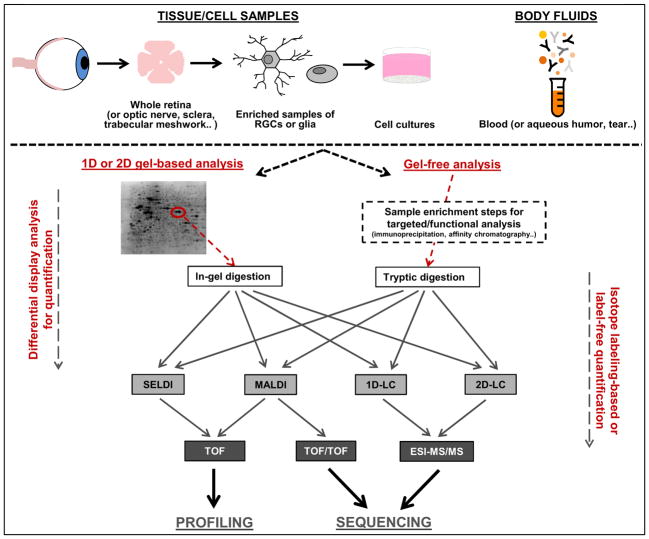
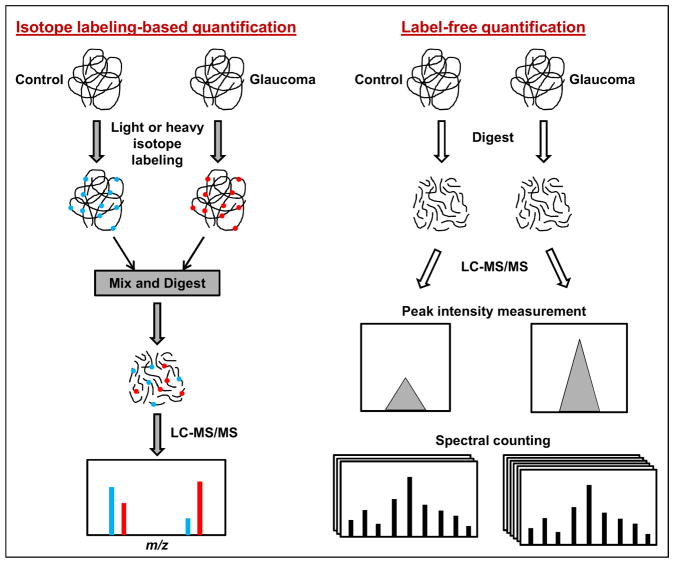
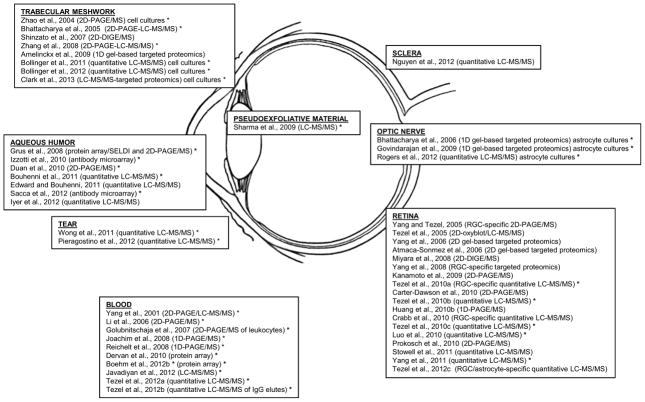
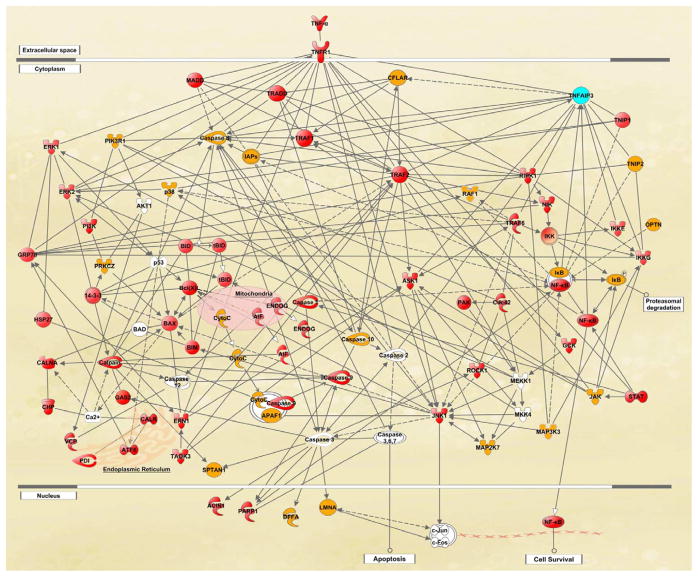
Despite improving understanding of glaucoma, key molecular players of neurodegeneration that can be targeted for treatment of glaucoma, or molecular biomarkers that can be useful for clinical testing, remain unclear. Proteomics technology offers a powerful toolbox to accomplish these important goals of the glaucoma research and is increasingly being applied to identify molecular mechanisms and biomarkers of glaucoma. Recent studies of glaucoma using proteomics analysis techniques have resulted in the lists of differentially expressed proteins in human glaucoma and animal models. The global analysis of protein expression in glaucoma has been followed by cell-specific proteome analysis of retinal ganglion cells and astrocytes. The proteomics data have also guided targeted studies to identify post-translational modifications and protein-protein interactions during glaucomatous neurodegeneration. In addition, recent applications of proteomics have provided a number of potential biomarker candidates. Proteomics technology holds great promise to move glaucoma research forward toward new treatment strategies and biomarker discovery. By reviewing the major proteomics approaches and their applications in the field of glaucoma, this article highlights the power of proteomics in translational and clinical research related to glaucoma and also provides a framework for future research to functionally test the importance of specific molecular pathways and validate candidate biomarkers.


Figures

Figure 1
Figure 1
Proteomics workflow. Both gel-based and gel-free proteomics techniques using mass spectrometry have been increasingly employed for high-throughput characterization of protein expression in glaucomatous human tissues and in vitro and in vivo experimental models. Proteomics analysis techniques also enable biomarker discovery in glaucoma.
Figure 2
Figure 2
Quantitative proteomics analysis workflow. Both isotope labeling-based and label-free techniques using mass spectrometry have been applied for relative quantification of protein expression between glaucomatous and control samples.
Figure 3
Figure 3
Proteomics studies towards molecular mechanisms and biomarkers of glaucoma. A number of studies of human glaucoma and in vitro and in vivo experimental models have used proteomics analysis techniques. Distinct proteomics techniques have been applied to analyse diverse sample types, including optic nerve, retina, sclera, trabecular meshwork, aqueous humor, pseudoexfoliative material, tear, and blood. Ocular samples included tissue lysates unless indicated otherwise, such as cell cultures or enriched samples of RGCs or astrocytes. Blood samples included whole serum, IgG elutes, or isolated leukocytes. * indicates the studies including human samples. Proteomics analysis of glaucoma has resulted in the lists of differentially expressed proteins and contributed to current understanding of molecular mechanisms and biomarkers of glaucoma.
Figure 4
Figure 4
Global proteomics analysis of the glaucomatous human retina. To determine alterations in retinal protein expression, retinal protein samples obtained from human donor eyes with or without glaucoma were analyzed by label-free quantitative 2D-LC-MS/MS analysis. The knowledge-based analysis of the generated high-throughput datasets established extended networks of diverse functional interactions between death-promoting and survival-promoting pathways and mediation of immune response. Up-regulated pathways included death receptor-mediated caspase cascade, mitochondrial dysfunction, endoplasmic reticulum stress, and calpains leading to apoptotic cell death; and NF-κB and JAK/STAT pathways, and inflammasome mediating inflammation. Proteins shown in red color exhibited significantly increased expression and shown in yellow color no significantly increased expression in glaucomatous samples relative to non-glaucomatous controls, while the protein shown in blue color exhibited prominent individual differences. Proteins shown in white color were not detectable by quantitative LC-MS/MS. This simplified network, generated using the Ingenuity Pathways Analysis, has recently been published (Yang et al., 2011).
Figure 5
Figure 5
Targeted proteomics analysis of experimental rat glaucoma. As an effort to explore specific protein interactions in an experimental rat model of glaucoma, 14-3-3-containing retinal protein complexes were eluted using co-immunoprecipitation and recombinant protein-based affinity pull-down for subsequent analysis by mass spectrometry. Based on the proteomics data and in vivo treatment experiments in rats, 14-3-3 proteins were found to control the subcellular localization of and function of Bad in a phosphorylation-dependent manner, and thereby constitute an important regulatory pathway of RGC death signaling during glaucomatous neurodegeneration. This flow diagram has recently been published (Yang et al., 2008).
Figure 6
Figure 6
Cell-specific proteomics analysis of glaucoma. A. Western blot analysis using antibodies to specific cell markers validated enriched samples of retinal astrocytes and RGCs through the immunomagnetic cell isolation process. Only neuronal markers (NeuN and Thy-1.1) were detectable in RGC samples, while astrocyte samples exhibited prominent immunolabeling for astrocyte markers, ASTRO1 and GFAP. Despite faint immunoreactivity of enriched astrocyte samples for GS (a marker for Müller cells) and CRALBP (expressed in Müller cells and retinal pigment epithelium), these samples were negative for RPE65, a marker for retinal pigment epithelium or neuronal markers. Presented data represent three independent sets of analyses with different samples. B. Bioinformatics analysis of the comparative proteomic data by the Ingenuity Pathways Analysis supported distinct responses of astrocytes and RGCs in ocular hypertensive rat eyes. Shown are functional groups of the up-regulated proteins in ocular hypertensive astrocytes and RGCs relative to their controls. While ocular hypertensive samples of RGCs predominantly exhibited stress response and cell death signaling, cellular activation and immune/inflammatory responses were most prominent in ocular hypertensive astrocytes. This figure has recently been published (Tezel et al., 2012c).
Figure 7
Figure 7
I nflammatory responses of astrocytes in ocular hypertensive rat retinas. In this simplified network generated by The Ingenuity Pathways Analysis, astrocyte proteins shown in red color exhibited significantly increased expression in ocular hypertensive samples relative to normotensive controls. Based on the high-throughput proteomics data validated by Western blot analysis and immunohistocemical labeling, TNF-α/TNFR signaling, NF-κB activation, JAK/STAT signaling, TLR signaling, and inflammasome appear to be co-players of inflammatory responses mediated by ocular hypertensive astrocytes. This figure has recently been published (Tezel et al., 2012c).
Figure 8
Figure 8
P otential biomarker candidates of glaucoma. Direct analysis of un-depleted serum samples collected from different groups of patients with primary open-angle glaucoma with normal intraocular pressure (POAG) or pseudoexfolative glaucoma (XFG) and control subjects without resulted in a list of 325 proteins, 248 of which were common to three sample groups. Listed are 22 proteins that were detected only in glaucomatous samples. This data has recently been presented (Tezel et al., 2012a).

Similar articles

Cited by

References

    1. Aebersold R, Mann M. Mass spectrometry-based proteomics. Nature. 2003;422:198–207. - PubMed
    1. Aggarwal K, Choe LH, Lee KH. Shotgun proteomics using the iTRAQ isobaric tags. Briefings in functional genomics & proteomics. 2006;5:112–120. - PubMed
    1. Agrawal GK, Thelen JJ. A high-resolution two dimensional Gel- and Pro-Q DPS-based proteomics workflow for phosphoprotein identification and quantitative profiling. Methods Mol Biol. 2009;527:3–19. ix. - PubMed
    1. Almasieh M, Wilson AM, Morquette B, Cueva Vargas JL, Di Polo A. The molecular basis of retinal ganglion cell death in glaucoma. Prog Retin Eye Res. 2012;31:152–181. - PubMed
    1. Amelinckx A, Castello M, Arrieta-Quintero E, Lee T, Salas N, Hernandez E, Lee RK, Bhattacharya SK, Parel JM. Laser trabeculoplasty induces changes in the trabecular meshwork glycoproteome: a pilot study. J Proteome Res. 2009;8:3727–3736. - PMC - PubMed

Publication types