. 2013 Mar;10(3):228-38.
doi: 10.1038/nmeth.2365. Epub 2013 Feb 10.

Critical assessment of automated flow cytometry data analysis techniques

Collaborators, Affiliations

Critical assessment of automated flow cytometry data analysis techniques

Nima Aghaeepour et al. Nat Methods. 2013 Mar.

Erratum in

  • Nat Methods. 2013 May;10(5):445

Abstract

Traditional methods for flow cytometry (FCM) data processing rely on subjective manual gating. Recently, several groups have developed computational methods for identifying cell populations in multidimensional FCM data. The Flow Cytometry: Critical Assessment of Population Identification Methods (FlowCAP) challenges were established to compare the performance of these methods on two tasks: (i) mammalian cell population identification, to determine whether automated algorithms can reproduce expert manual gating and (ii) sample classification, to determine whether analysis pipelines can identify characteristics that correlate with external variables (such as clinical outcome). This analysis presents the results of the first FlowCAP challenges. Several methods performed well as compared to manual gating or external variables using statistical performance measures, which suggests that automated methods have reached a sufficient level of maturity and accuracy for reliable use in FCM data analysis.


Conflict of interest statement

At the time of this study, J.Q. was an employee of Tree Star Inc., and P. Májek and J.V. were employees of ADINIS s.r.o. and consultants for Cytobank Inc., which make commercial FCM analysis software. G.N. is a consultant, equity holder and member of a scientific advisory board and/or board of directors at Nodality, DVS Sciences, Beckton Dickinson, Cell Signaling Technologies, BINA Technologies, and 5AM Ventures.

Figures
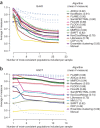
Figure 1
Figure 1. F-measure results of cell population identification challenges.
Average manual and algorithm F-measures are represented against the manual consensus cluster as a function of the number of populations included, ranked from most consistent to least consistent. For a given population, consistency was defined as the agreement among manual gates, calculated as the average manual F-measures against the manual consensus cluster for that population. All populations across all samples were included in this calculation, and, as such, the numbers on the x axis should be multiplied by 12 and 30 (for GvHD and HSCT, respectively) to reflect the total number of populations in all samples in the reference. Individual manual gating results are plotted as gray lines. (a) Graft-versus-host disease (GvHD) data set. (b) Hematopoietic stem cell transplant (HSCT) data set.
Figure 2
Figure 2. Per-population pairwise comparisons of the cell population identification challenges.
Average F-measures of all pairs of results for the five cell populations across all samples in the hematopoietic stem cell transplant (HSCT) data set are represented as heat maps. The heat-map color in individual squares reflects the pairwise agreement between each method for each cell population independently, and the position in the matrix reflects the pattern of agreement across all methods on the basis of hierarchical clustering. The manual-gate consensus cluster for each sample was used as a reference for matching of the automated results of that sample. Pairwise F-measures between all algorithms and manual gates for the HSCT data set are shown. The dendrogram groups the algorithms and manual gates on the basis of the similarities between their pairwise F-measures. EC, ensemble clustering.
Figure 3
Figure 3. Comparison of manual-gate consensus and ensemble clustering results.
Dots are color-coded by population membership as determined by ensemble clustering, with donor-derived (CD45.2+) granulocytes/monocytes in green and donor-derived lymphocytes in red. Colored polygons enclose regions corresponding to the consensus clustering of manual gates. Fluorochromes used: FITC, fluorescein isothiocyanate; PE, phycoerythrin; APC, allophycocyanin. (a,b) Sample for which all of the cell populations have been accurately identified. (c,d) Sample in which the tail of the blue population has been misclassified as orange by the algorithms, resulting in a lower F-measure for the blue population. The red, blue, green, purple and orange cell populations match cell population 1–5 of Figure 2, respectively.
Figure 4
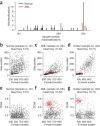
Figure 4. Acute myeloid leukemia (AML) subject detected as an outlier by the algorithms.
(a) Total number of misclassifications for each sample in the test set (sample nos. 180–359) of the AML data set. (bg) Forward scatter (FSC)/side scatter (bd) and FSC/CD34 (eg) plots of representative normal (b,e) and AML (c,f) samples and the outlier sample no. 340 (d,g), with the CD34+ cells highlighted in red. Cell proportions of the CD34+ population are reported as blast frequency (freq.) percentages.

References

    1. Baumgarth N, Roederer M. A practical approach to multicolor flow cytometry for immunophenotyping. J. Immunol. Methods. 2000;243:77–97. doi: 10.1016/S0022-1759(00)00229-5. - DOI - PubMed
    1. Tanner SD, et al. Flow cytometer with mass spectrometer detection for massively multiplexed single-cell biomarker assay. Pure Appl. Chem. 2008;80:2627–2641. doi: 10.1351/pac200880122627. - DOI
    1. Bendall SC, Nolan GP, Roederer M, Chattopadhyay PK. A deep profiler′s guide to cytometry. Trends Immunol. 2012;33:323–332. doi: 10.1016/j.it.2012.02.010. - DOI - PMC - PubMed
    1. Newell EW, Sigal N, Bendall SC, Nolan GP, Davis MM. Cytometry by time-of-flight shows combinatorial cytokine expression and virus-specific cell niches within a continuum of CD8+ T cell phenotypes. Immunity. 2012;36:142–152. doi: 10.1016/j.immuni.2012.01.002. - DOI - PMC - PubMed
    1. Lugli E, Roederer M, Cossarizza A. Data analysis in flow cytometry: the future just started. Cytometry A. 2010;77:705–713. doi: 10.1002/cyto.a.20901. - DOI - PMC - PubMed

Publication types

MeSH terms