

The effect of one additional driver mutation on tumor progression
- PMID: 23396615
- PMCID: PMC3567469
- DOI: 10.1111/eva.12020
The effect of one additional driver mutation on tumor progression
Abstract
Tumor growth is caused by the acquisition of driver mutations, which enhance the net reproductive rate of cells. Driver mutations may increase cell division, reduce cell death, or allow cells to overcome density-limiting effects. We study the dynamics of tumor growth as one additional driver mutation is acquired. Our models are based on two-type branching processes that terminate in either tumor disappearance or tumor detection. In our first model, both cell types grow exponentially, with a faster rate for cells carrying the additional driver. We find that the additional driver mutation does not affect the survival probability of the lesion, but can substantially reduce the time to reach the detectable size if the lesion is slow growing. In our second model, cells lacking the additional driver cannot exceed a fixed carrying capacity, due to density limitations. In this case, the time to detection depends strongly on this carrying capacity. Our model provides a quantitative framework for studying tumor dynamics during different stages of progression. We observe that early, small lesions need additional drivers, while late stage metastases are only marginally affected by them. These results help to explain why additional driver mutations are typically not detected in fast-growing metastases.
Keywords: branching process; cancer; clonal expansion; density dependence; driver mutation; stochastic models.
Figures
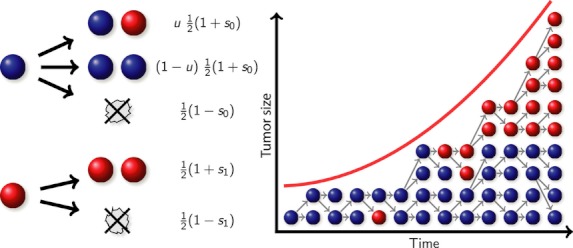
 , while mutant cells (red) have a division probability of
  . Additionally, resident cells may mutate upon division, with probability u.
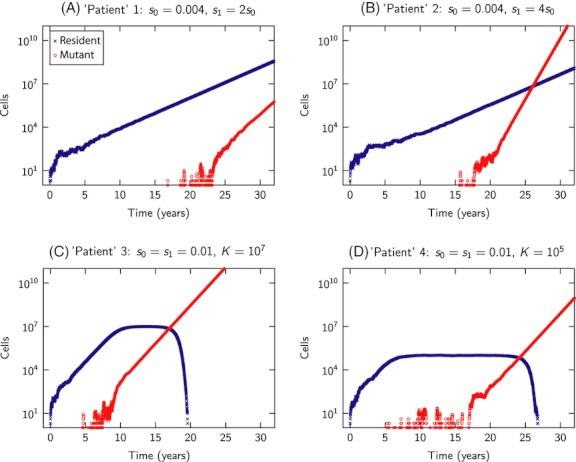
 in A vs
  in B) increases its survival probability and reduces the time until the mutant type becomes dominant. In C and D, the additional driver mutation is neutral (
 ). The resident cells decline at the point when the mutant cells (and hence the total number of cells) exceed the carrying capacity of the resident cells. In C, we have αKu > 1; thus, the mutant type arises while the resident type is still expanding (see “Logistic growth model” subsection of Results). In D, we have αKu < 1 and hence the resident population remains at carrying capacity for a significant period of time before the mutant type arises. Parameter values: driver mutation rate
  , average cell division time is 3 days.
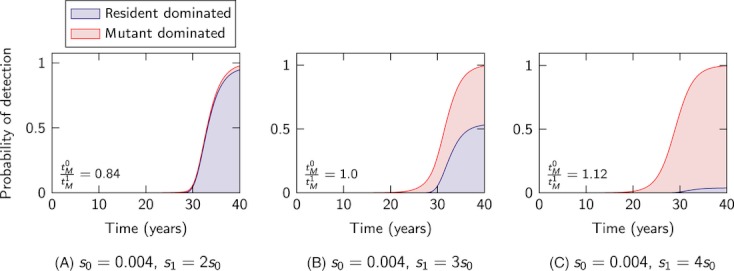
 ), as calculated from
  simulation runs. The blue shaded regions correspond to tumors dominated by resident cells (more than 50% of the tumor cells at detection time are resident), while the red shaded regions correspond to tumors dominated by mutant cells at detection time (more than 50% of the tumor cells at detection time are mutants). The tumor composition at detection time can be estimated by the ratio
  . Parameter values: driver mutation rate
  , detection size
  cells, average cell division time is 3 days.
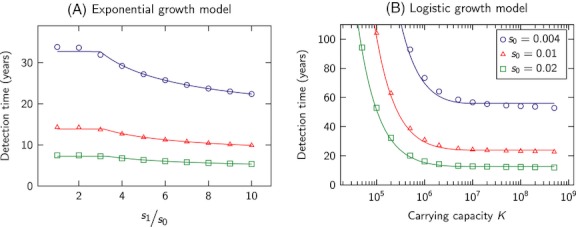
 ). We see that small carrying capacities (with αKu < 1) significantly slow tumor progression, while large carrying capacities (αKu > 1) have little effect. Simulation results are averages over
  runs. Parameter values: detection size
  cells, driver mutation rate
  , average cell division time is 3 days.
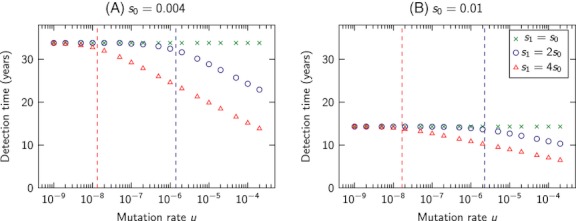
 runs. Parameter values: detection size
  cells, average cell division time is 3 days.
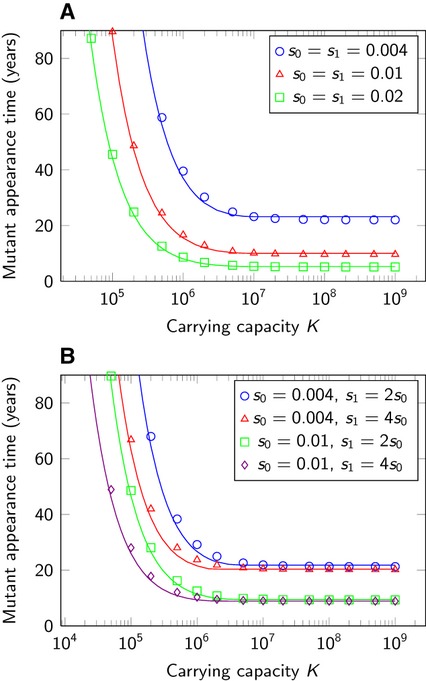
 runs. Parameter values: detection size
  cells, driver mutation rate
  , average cell division time is 3 days.
References
-
- Albertini R, Nicklas J, O'Neill J, Robison S. In vivo somatic mutations in humans: measurement and analysis. Annual Review of Genetics. 1990;24:305–326. - PubMed
-
- Amerlöv C, Emdin S, Lundgren B, Roos G, Soderström J, Bjersing L, Norberg C, et al. Breast carcinoma growth rate described by mammographic doubling time and S-phase fraction. Correlations to clinical and histopathologic factors in a screened population. Cancer. 1992;70:1928–1934. - PubMed
-
- Antal T, Krapivsky PL. Exact solution of a two-type branching process: models of tumor progression. Journal of Statistical Mechanics, 2011:P08018.
-
- Athreya K, Ney P. Branching Processes. Berlin: Springer-Verlag; 1972.
Grants and funding
LinkOut - more resources
Full Text Sources
