. 2013 May;12(5):1319-34.
doi: 10.1074/mcp.M112.024182. Epub 2013 Feb 8.

Proteomics of genetically engineered mouse mammary tumors identifies fatty acid metabolism members as potential predictive markers for cisplatin resistance

Affiliations

Proteomics of genetically engineered mouse mammary tumors identifies fatty acid metabolism members as potential predictive markers for cisplatin resistance

Marc Warmoes et al. Mol Cell Proteomics. 2013 May.

Abstract

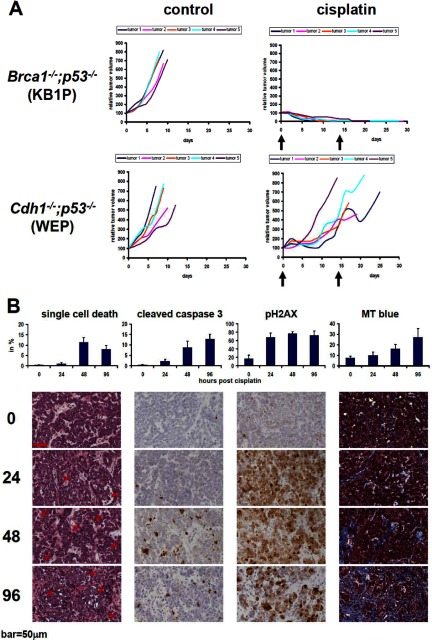
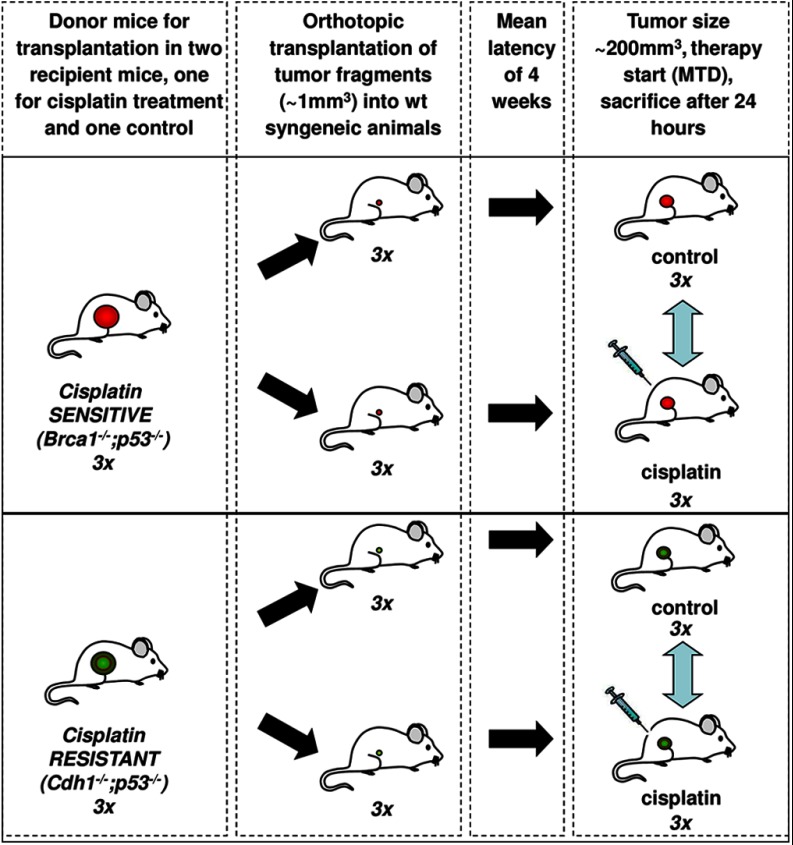
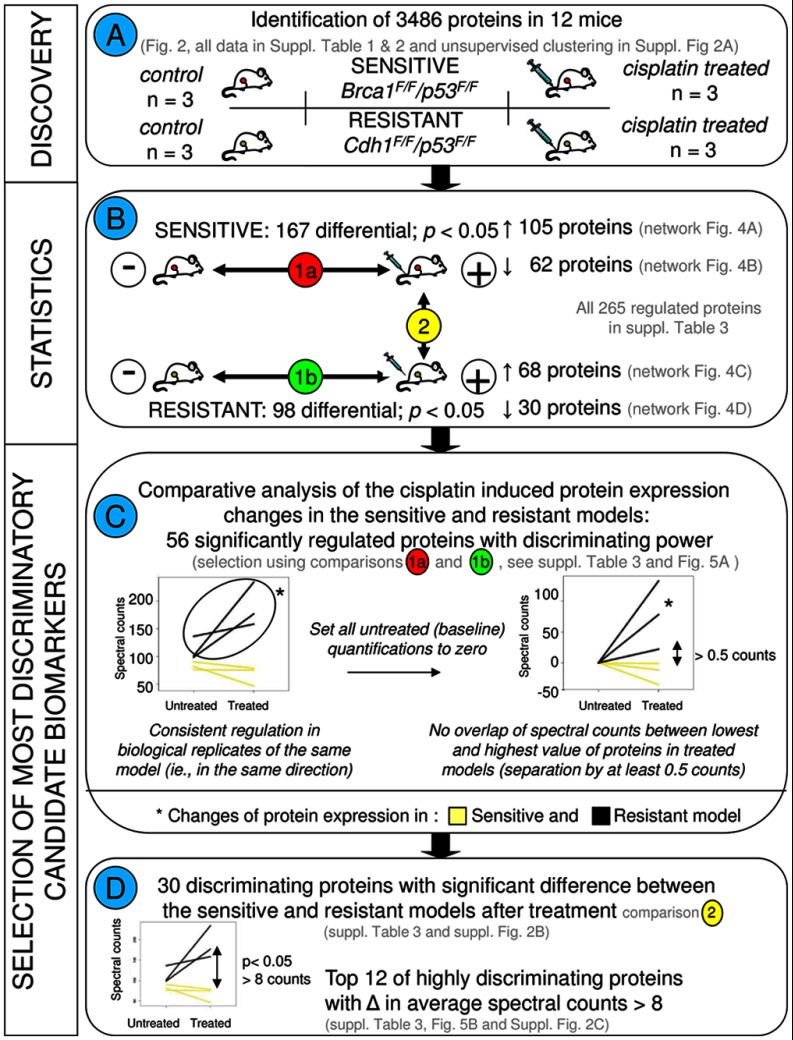
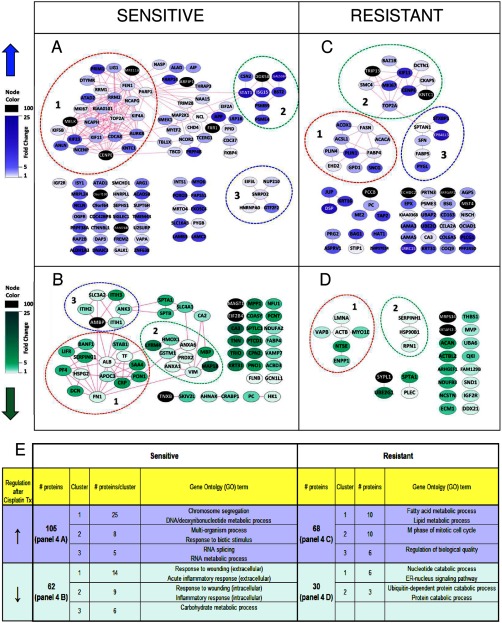
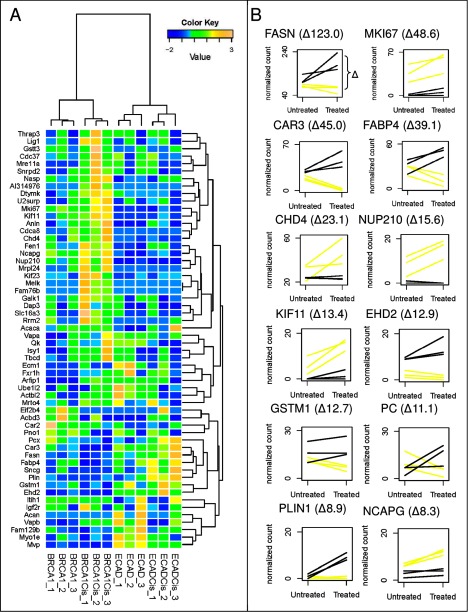
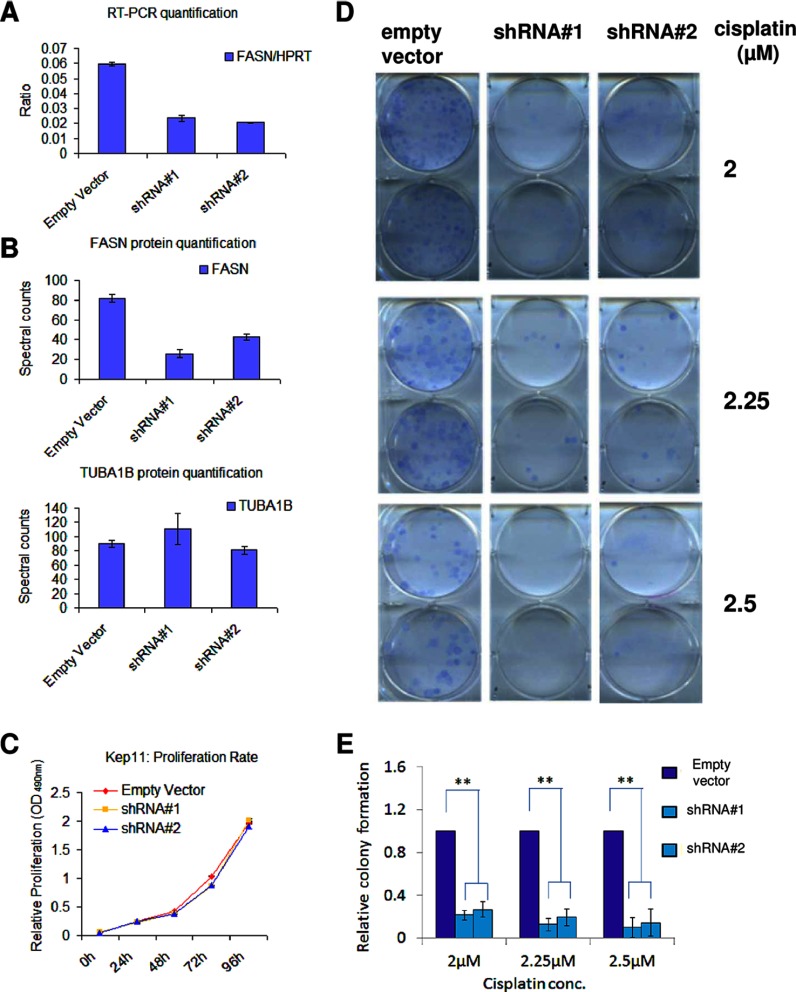
In contrast to various signatures that predict the prognosis of breast cancer patients, markers that predict chemotherapy response are still elusive. To detect such predictive biomarkers, we investigated early changes in protein expression using two mouse models for distinct breast cancer subtypes who have a differential knock-out status for the breast cancer 1, early onset (Brca1) gene. The proteome of cisplatin-sensitive BRCA1-deficient mammary tumors was compared with that of cisplatin-resistant mammary tumors resembling pleomorphic invasive lobular carcinoma. The analyses were performed 24 h after administration of the maximum tolerable dose of cisplatin. At this time point, drug-sensitive BRCA1-deficient tumors showed DNA damage, but cells were largely viable. By applying paired statistics and quantitative filtering, we identified highly discriminatory markers for the sensitive and resistant model. Proteins up-regulated in the sensitive model are involved in centrosome organization, chromosome condensation, homology-directed DNA repair, and nucleotide metabolism. Major discriminatory markers that were up-regulated in the resistant model were predominantly involved in fatty acid metabolism, such as fatty-acid synthase. Specific inhibition of fatty-acid synthase sensitized resistant cells to cisplatin. Our data suggest that exploring the functional link between the DNA damage response and cancer metabolism shortly after the initial treatment may be a useful strategy to predict the efficacy of cisplatin.


Figures

Fig. 1.
Fig. 1.
Responses of Brca1−/−;p53−/− (KB1P) or Cdh1−/−;p53−/− (WEP) mammary tumors to cisplatin. A, five individual KB1P or WEP tumors were transplanted orthotopically into syngeneic mice. Once tumors reached a volume of 200 mm3, they were left untreated or treated with the maximum tolerable dose of cisplatin (6 mpk i.v. on days 0 and 14). B, analyses of drug-sensitive KB1P tumors using H&E staining (arrows indicate examples of cells with morphological characteristics of single cell death such as fragmented or pyknotic nuclei and hypereosinophilic cytoplasm), cleaved caspase 3, pH2AX, and Masson's trichrome stain (MT). Bar, 50 μm.
Fig. 2.
Fig. 2.
Experimental setup for the high throughput proteomics experiment using KB1P or WEP mouse models with and without cisplatin treatment.
Fig. 3.
Fig. 3.
Flow chart depicting the different comparisons and criteria for selection of the most discriminatory biomarkers. A, describes the discovery experiment including four groups consisting of cisplatin-sensitive and -resistant models with the control and cisplatin treatment groups for each model, with three animals in each group. B, displays the statistical comparisons. All statistical analyses were performed using R as described previously (17, 18). To select the most discriminatory markers, we applied quantitative filtering in Excel. To this end, protein spectral count data of the 3486 proteins were exported from Scaffold to Excel. Paired statistical testing (18) in R identifies differentially expressed proteins between the treated and untreated tumors in each tumor type separately (comparisons 1a and 1b). C, shows the criteria to select for proteins with divergent regulation in the sensitive and resistant model. To this end, base-line transformation was applied to each protein. Furthermore, only proteins were retained that displayed a minimum separation of 0.5 counts between the lowest and the highest value in the two models after cisplatin treatment. This led to a selection of 56 discriminatory candidate markers. Left graph, example of untransformed spectral counts for the sensitive and resistant paired sets. Right graph, example using the same protein, with untreated tumors brought to a base line of zero counts. D, further selection was made to pinpoint the most discriminatory proteins. Using β-binomial statistics (17) on the list of 56 proteins, we selected 30 proteins who were significantly different between the sensitive and resistant models after cisplatin treatment (comparison 2 in B). From these 30 proteins, the top 12 was selected with highly divergent regulation patterns in the two models, i.e. proteins displaying on average at least eight counts of separation between the average values in both models after treatment (before base-line transformation).
Fig. 4.
Fig. 4.
Protein-protein networks of the regulated proteins selected using a paired statistical analysis between treated and untreated conditions. The networks were generated using default settings in String (and visualized using Cytoscape. Dashed lines indicate the top three most significant clusters identified by Cluster ONE analysis. Nodes represent proteins, and the edges represent interactions that include direct (physical) and indirect (functional) associations. See Szklarczyk et al. (19) for more details on edge generation. A, up-regulated proteins in the cisplatin-sensitive tumors. B, down-regulated proteins in the cisplatin-sensitive tumors. C, up-regulated proteins in the cisplatin-resistant tumors. D, down-regulated proteins in the cisplatin-resistant tumors. E, representative GO terms identified by BiNGO analysis for the top three clusters within the regulated proteins.
Fig. 5.
Fig. 5.
A, hierarchical cluster analysis of the top 56 discriminatory proteins, showing complete separation of all four control and treatment conditions of the cisplatin-sensitive (KB1P) and -resistant (WEP) tumors. B, expression profiles using spectral counting of the 12 significant proteins with at least eight spectral count differences between the two treated tumor types. Expression profiles were constructed using normalized spectral counts. Lines connect paired samples before and after treatment. Yellow lines represent the three sensitive tumors before and after treatment, and black lines represent the resistant tumors.
Fig. 6.
Fig. 6.
Fasn knockdown and clonogenic survival after cisplatin treatment in Cdh1−/−;p53−/− (KEP11) cells. A, knockdown efficacy of two shRNA hairpins targeting Fasn and an empty vector as determined by quantitative RT-PCR. Hprt gene expression was used as reference. All experiments were performed in triplicate, and the error bars indicate S.D. (also for B and C). B, knockdown efficacy of the same two shRNA hairpins targeting and empty vector at the protein level as determined by mass spectrometry. TUBA1B expression is shown as a reference. C, proliferation rate of the cell lines transduced with the two Fasn-targeting shRNAs and empty vector. D, clonogenic survival of the cell lines transduced with the two Fasn-targeting shRNAs and empty vector after cisplatin treatment. Six, 8, or 9 days after treatment with 2, 2.25, or 2.5 μm cisplatin, respectively, the surviving colonies were stained. This experiment was carried out in triplicate, and a representative result is shown. E, quantification of D. Average colony numbers of cells with the Fasn-targeting shRNAs are presented relative to the number of colonies of the control cells. The error bars indicate S.D., and ** indicates a p < 0.001 (Student's t test).

References

    1. Borst P., Wessels L. (2010) Do predictive signatures really predict response to cancer chemotherapy? Cell Cycle 9, 4836–4840 - PubMed
    1. Liu X., Holstege H., van der Gulden H., Treur-Mulder M., Zevenhoven J., Velds A., Kerkhoven R. M., van Vliet M. H., Wessels L. F., Peterse J. L., Berns A., Jonkers J. (2007) Somatic loss of BRCA1 and p53 in mice induces mammary tumors with features of human BRCA1-mutated basal-like breast cancer. Proc. Natl. Acad. Sci. U.S.A. 104, 12111–12116 - PMC - PubMed
    1. Rottenberg S., Nygren A. O., Pajic M., van Leeuwen F. W., van der Heijden I., van de Wetering K., Liu X., de Visser K. E., Gilhuijs K. G., van Tellingen O., Schouten J. P., Jonkers J., Borst P. (2007) Selective induction of chemotherapy resistance of mammary tumors in a conditional mouse model for hereditary breast cancer. Proc. Natl. Acad. Sci. U.S.A. 104, 12117–12122 - PMC - PubMed
    1. Vollebergh M. A., Lips E. H., Nederlof P. M., Wessels L. F., Schmidt M. K., van Beers E. H., Cornelissen S., Holtkamp M., Froklage F. E., de Vries E. G., Schrama J. G., Wesseling J., van, d. V., van T. H., de B. M., Hauptmann M., Rodenhuis S., Linn S. C. (2010) An aCGH classifier derived from BRCA1-mutated breast cancer and benefit of high-dose platinum-based chemotherapy in HER2-negative breast cancer patients. Ann. Oncol., 22, 1561–1570 - PMC - PubMed
    1. Silver D. P., Richardson A. L., Eklund A. C., Wang Z. C., Szallasi Z., Li Q., Juul N., Leong C. O., Calogrias D., Buraimoh A., Fatima A., Gelman R. S., Ryan P. D., Tung N. M., De Nicolo A., Ganesan S., Miron A., Colin C., Sgroi D. C., Ellisen L. W., Winer E. P., Garber J. E. (2010) Efficacy of neoadjuvant cisplatin in triple-negative breast cancer. J. Clin. Oncol. 28, 1145–1153 - PMC - PubMed

Publication types

MeSH terms