. 2013 May;12(5):1335-49.
doi: 10.1074/mcp.O112.020404. Epub 2013 Feb 8.

Analysis of protein-protein interactions in cross-talk pathways reveals CRKL protein as a novel prognostic marker in hepatocellular carcinoma

Affiliations

Analysis of protein-protein interactions in cross-talk pathways reveals CRKL protein as a novel prognostic marker in hepatocellular carcinoma

Chia-Hung Liu et al. Mol Cell Proteomics. 2013 May.

Abstract

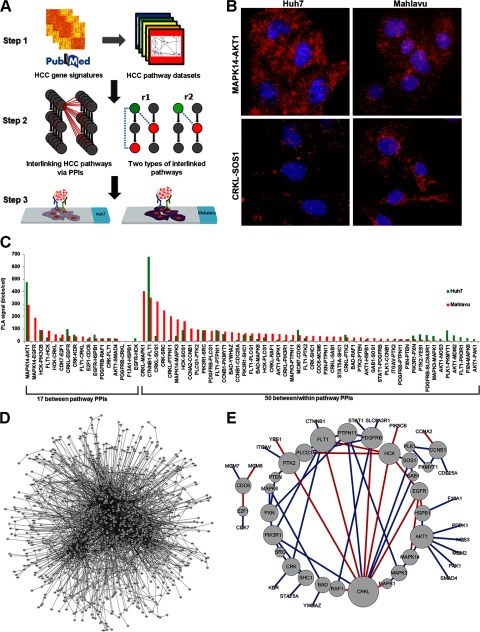
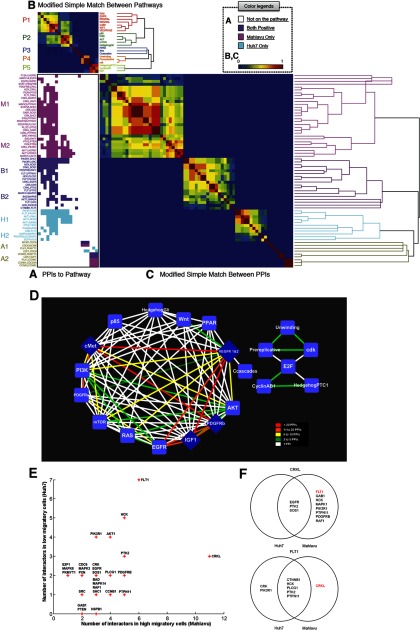
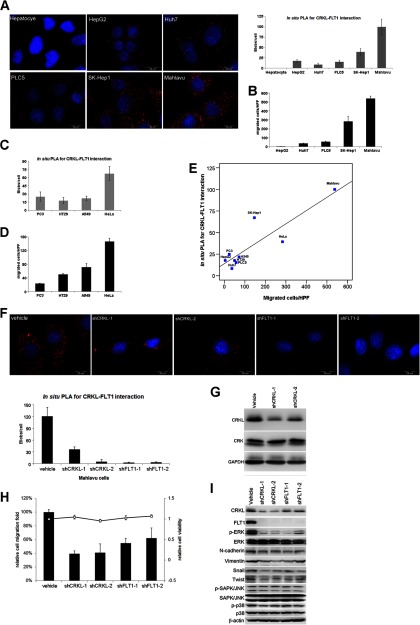
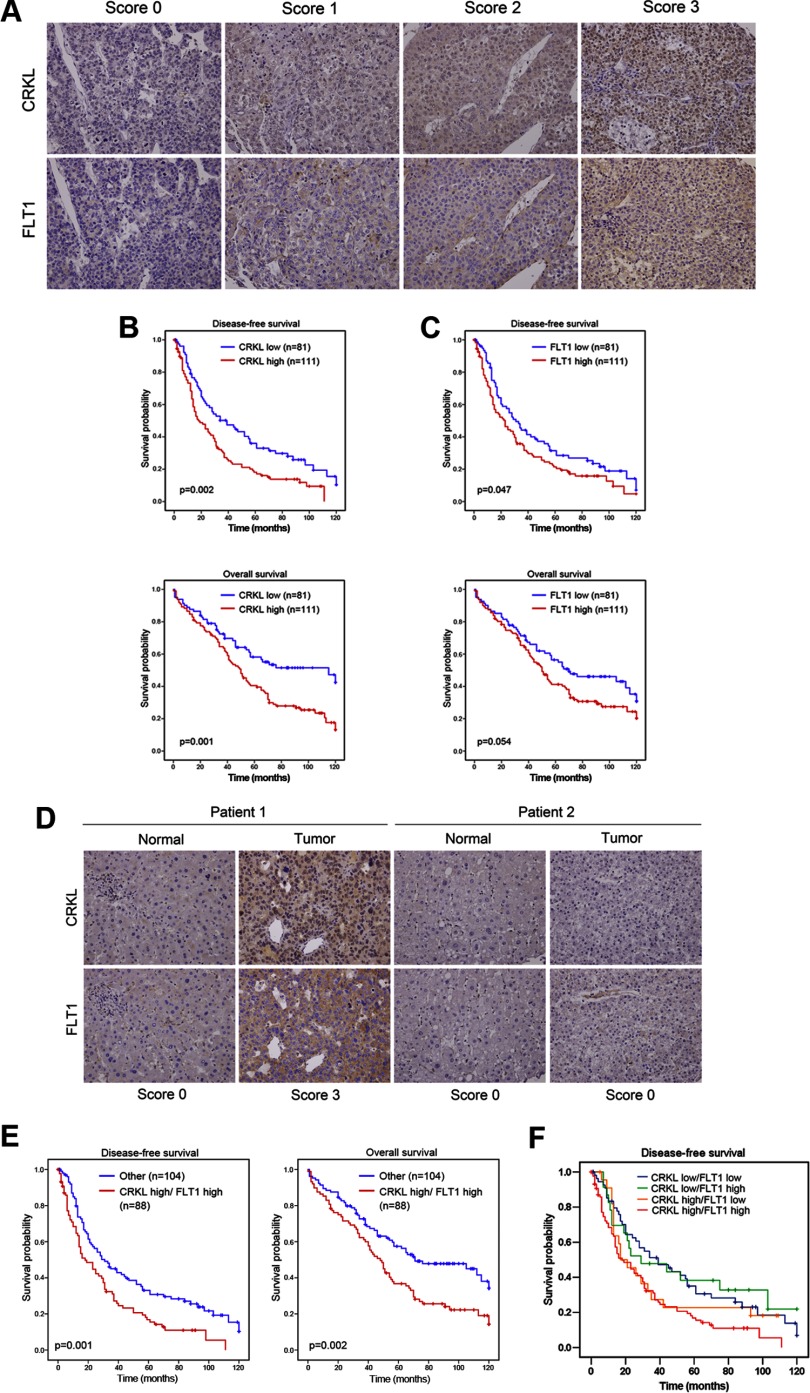
Deciphering the network of signaling pathways in cancer via protein-protein interactions (PPIs) at the cellular level is a promising approach but remains incomplete. We used an in situ proximity ligation assay to identify and quantify 67 endogenous PPIs among 21 interlinked pathways in two hepatocellular carcinoma (HCC) cells, Huh7 (minimally migratory cells) and Mahlavu (highly migratory cells). We then applied a differential network biology analysis and determined that the novel interaction, CRKL-FLT1, has a high centrality ranking, and the expression of this interaction is strongly correlated with the migratory ability of HCC and other cancer cell lines. Knockdown of CRKL and FLT1 in HCC cells leads to a decrease in cell migration via ERK signaling and the epithelial-mesenchymal transition process. Our immunohistochemical analysis shows high expression levels of the CRKL and CRKL-FLT1 pair that strongly correlate with reduced disease-free and overall survival in HCC patient samples, and a multivariate analysis further established CRKL and the CRKL-FLT1 as novel prognosis markers. This study demonstrated that functional exploration of a disease network with interlinked pathways via PPIs can be used to discover novel biomarkers.


Figures

Fig. 1.
Fig. 1.
Schematic illustration of the major steps in our combined computational and experimental approaches to identify interlinked PPIs in signaling pathways. A, Step 1, identification of HCC-related pathways. We identified 60 HCC-related pathways (443 proteins) by applying a hypergeometric test with the HCC gene signatures set and pathway databases. Step 2, interlinking of PPIs in signaling pathways. The proteins belonging to the HCC-related pathways (gray nodes on left side) indicated whether any PPIs (red dotted line on left side) with overexpressed patterns could link each pathway and enable potential interlinking. Eventually, we identified 194 PPIs with the potential for interlinking. This topological property suggests that interlinked PPIs can be categorized into two classes as follows: r1) between/within pathway PPIs, and r2) between pathway PPIs. Step 3, PPIs that had available antibody pairs were identified and further tested in HCC cell lines with in situ PLA technology. We validated 67 PPIs in this step. B, MAPK14-AKT1 (top) interaction was highly expressed in Huh7 cells and in Mahlavu cells; the CRKL-SOS1 (bottom) interaction was higher in Mahlavu cells than Huh7 cells. C, histogram of PLA signals for 67 validated PPIs showed a differential expression pattern between Huh7 and Mahlavu cells. D, huge PPI network from up-regulated genes (1062 nodes and 2777 edges). E, evaluation of the expression of PPIs from the in situ PLA assay in HCC. The color of each link in the sub-network (49 nodes and 67 edges) indicates whether its interaction can be observed through a manual curation of protein interactions from the literature (blue) or not (red). The interactions with red color are novel interactions. The node sizes correlate with the number of interactions. The combined computational and experimental approaches can construct effectively a concise empirical HCC PPI network (E) from a huge PPI network of up-regulated genes (D).
Fig. 2.
Fig. 2.
Tripartite association of PPIs, pathways and cell lines, and analysis of the differential interaction hubs in the PPI networks. Sixty seven positive PPIs within 21 pathways are displayed as a matrix map using generalized association plots (24, 25) with a measurement of modified SMC and hierarchical clustering. A, PPIs that are specific in Huh7, Mahlavu, both cell lines, or none are color coded as cyan, magenta, purple, or white, respectively; the 67 positive PPIs can also be partitioned into eight clusters (M1, M2, B1, B2, H1, H2, A1, and A2). The PPIs in the M1 and M2 clusters were observed only in Mahlavu cells, whereas the PPIs in the H1 and H2 clusters were observed only in Huh7 cells. The PPIs in the B1 and B2 clusters were observed in both cell lines. The PPIs in the A1 and A2 clusters were observed in either one cell line or both cell lines, but they did not belong to larger clusters because of the similarity of the corresponding pathways. B, similarity of the pathways is to measure the similarity of between-PPI using a modified SMC, which ranges from 0 (dissimilarity/no association, dark blue) to 1 (high similarity/perfect association, dark red). Abbreviations for the pathway names were used and different sets of colors were generated to represent branching structure of different hierarchical clustering trees. The shortened pathway names make the links between the matrix and clustering tree stand out much better, and the grouping (clustering) patterns are now visually more readily apparent. C, similarity of the PPIs is to measure the similarity of between-pathway using modified SMC and reveals the hierarchical linkage of the PPIs. D, inferred interlinked pathway map via interlinked PPIs. The nodes in this network represent pathways, and the edges in the network indicate whether at least one interlinked PPI can be observed through in situ PLA. The line colors reflect the number of the interlinked PPIs that appear within the pathway pairs. E, scatterplot shows the number of interactions in highly migratory cells (Mahlavu cell) and the number of interactors in minimally migratory cells (Huh7 cell) for each protein in this study. The proteins that only have one interactor in either Huh7 cells or Mahlavu cells are not labeled in this figure. F, Venn diagram showing the overlap of protein interactions and differential protein interactions in CRKL (top) and FLT1 (bottom). Three of the 11 CRKL interaction partners occurred in both minimally migratory cells and highly migratory cells, but the remaining eight partners only occurred in highly migratory cells. FLT1 has seven interaction partners, and the only partner that occurs in highly migratory cells is CRKL.
Fig. 3.
Fig. 3.
Characterization of the CRKL-FLT1 interaction in HCC cell lines. A, images (left) and quantification (right) of in situ PLA signal for CRKL-FLT1 interaction in hepatocytes and five HCC cell lines (HepG2, Huh7, PLC5, SK-Hep1, and Mahlavu) are shown. B, migratory ability and CRKL-FLT1 interaction were evaluated in five HCC cell lines. The Mahlavu cell is highly migratory cells among five HCC cell lines. The CRKL-FLT1 interaction via in situ PLA (C) and migratory ability (D) was measured in other cancers, including prostate cancer cells (PC3), colon cancer cells (HT29), lung cancer cells (A549), and cervical cancer (HeLa). E, CRKL-FLT1 expression was correlated with cell migration. The intensity of in situ PLA for CRKL-FLT1 interaction and migrated cells/high power field showed a positive correlation with a correlation coefficient = 0.886 (p < 0.001) as analyzed for Pearson product-moment correlation when we observed all nine cancer cells. F, five different stable clones of CRKL and FLT1 Mahlavu cells (vehicle (scramble control), shCRKL-1, shCRKL-2, shFLT1–1, and shFLT1–2) with knockdown of CRKL or FLT1 were established. The expression of CRKL-FLT1 interaction was decreased in Mahlavu stable clones with knockdown of CRKL or FLT1 compared with vehicle control cells. G, expression of CRK was not affected by knockdown of CRKL in Mahlavu cells. The shCRKL-1 and shCRKL-2 specifically target CRKL, but not CRK. H, knockdown of CRKL or FLT1 reduced migration ability compared with vehicle control cells. I, lysates from Mahlavu cells with CRKL or FLT1 knockdown were subject to Western blotting for mesenchymal markers and several markers of signaling pathways. Western blot analysis showed that both CRKL and FLT1 participated in the ERK but not in JNK or p38 signaling pathway and that they were also involved in EMT process. Vehicle, scramble control.
Fig. 4.
Fig. 4.
Overexpression of CRKL is a marker of poor prognosis in HCC. A, CRKL and FLT1 protein expression in a representative HCC specimen. The expression levels of CRKL and FLT1 were quantified according to the staining intensity. The results were stratified into two groups according to the intensity of staining; in the low expression group, either no staining was present (staining intensity score 0) or positive staining was detected in <10% of the cells (staining intensity score 1); in the high expression group, positive immunostaining was present in 10–30% (staining intensity score 2) or >30% of the cells (staining intensity score 3). A Kaplan-Meier curve of disease-free (up) and overall (down) survival in 192 HCC patients was stratified by CRKL (B) and FLT1 (C) expression. D, representative IHC staining of endogenous CRKL and FLT1 in serial paraffin sections of HCC tissue is shown. Note the significant positive correlation between the level of CRKL and that of FLT1 (correlation coefficient = 0.506, p < 0.001 using Spearman's nonparametric correlation test). E, disease-free (left) and overall (right) survival of 192 HCC patients according to the combination analysis of CRKL and FLT1 expression. F, disease-free survival analysis of HCC patients stratified by CRKL and FLT1 status.

References

    1. Jemal A., Siegel R., Ward E., Hao Y., Xu J., Murray T., Thun M. J. (2008) Cancer Statistics, 2008. CA-Cancer J. Clin. 58, 71–96 - PubMed
    1. Whittaker S., Marais R., Zhu A. X. (2010) The role of signaling pathways in the development and treatment of hepatocellular carcinoma. Oncogene 29, 4989–5005 - PubMed
    1. Barabási A.-L., Gulbahce N., Loscalzo J. (2011) Network medicine: a network-based approach to human disease. Nat. Rev. Genet. 12, 56–68 - PMC - PubMed
    1. Taylor I. W., Linding R., Warde-Farley D., Liu Y., Pesquita C., Faria D., Bull S., Pawson T., Morris Q., Wrana J. L. (2009) Dynamic modularity in protein interaction networks predicts breast cancer outcome. Nat. Biotechnol. 27, 199–204 - PubMed
    1. Chuang H.-Y., Lee E., Liu Y.-T., Lee D., Ideker T. (2007) Network-based classification of breast cancer metastasis. Mol. Syst. Biol. 3, 140. - PMC - PubMed

Publication types

MeSH terms