

Vaccination strategies for future influenza pandemics: a severity-based cost effectiveness analysis
- PMID: 23398722
- PMCID: PMC3637125
- DOI: 10.1186/1471-2334-13-81
Vaccination strategies for future influenza pandemics: a severity-based cost effectiveness analysis
Abstract
Background: A critical issue in planning pandemic influenza mitigation strategies is the delay between the arrival of the pandemic in a community and the availability of an effective vaccine. The likely scenario, born out in the 2009 pandemic, is that a newly emerged influenza pandemic will have spread to most parts of the world before a vaccine matched to the pandemic strain is produced. For a severe pandemic, additional rapidly activated intervention measures will be required if high mortality rates are to be avoided.
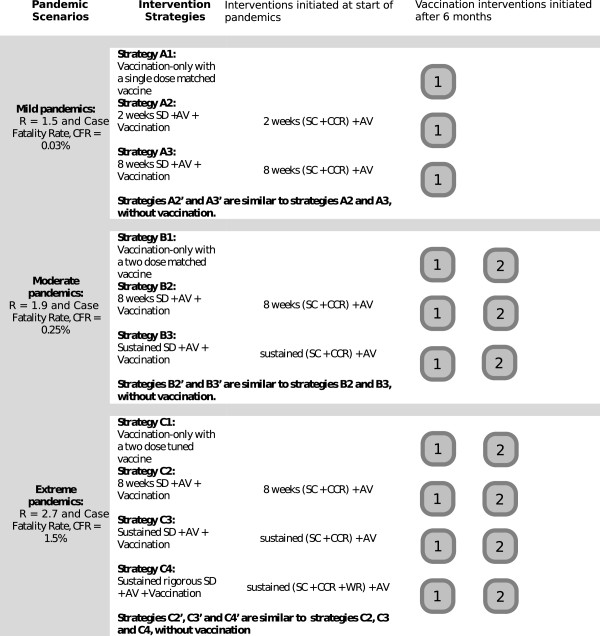
Methods: A simulation modelling study was conducted to examine the effectiveness and cost effectiveness of plausible combinations of social distancing, antiviral and vaccination interventions, assuming a delay of 6-months between arrival of an influenza pandemic and first availability of a vaccine. Three different pandemic scenarios were examined; mild, moderate and extreme, based on estimates of transmissibility and pathogenicity of the 2009, 1957 and 1918 influenza pandemics respectively. A range of different durations of social distancing were examined, and the sensitivity of the results to variation in the vaccination delay, ranging from 2 to 6 months, was analysed.
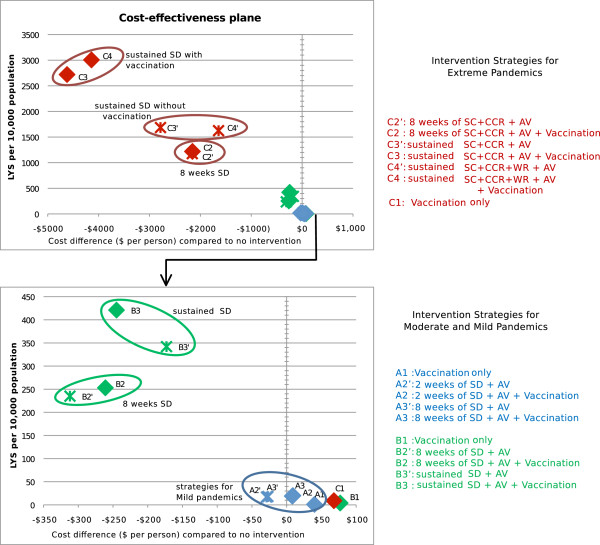
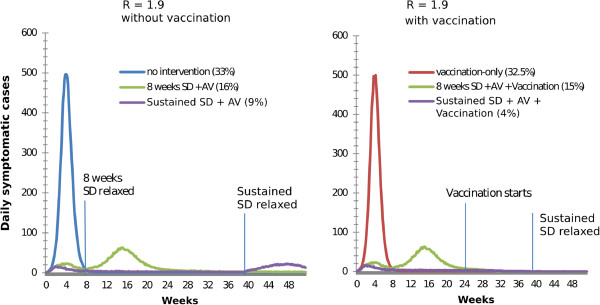
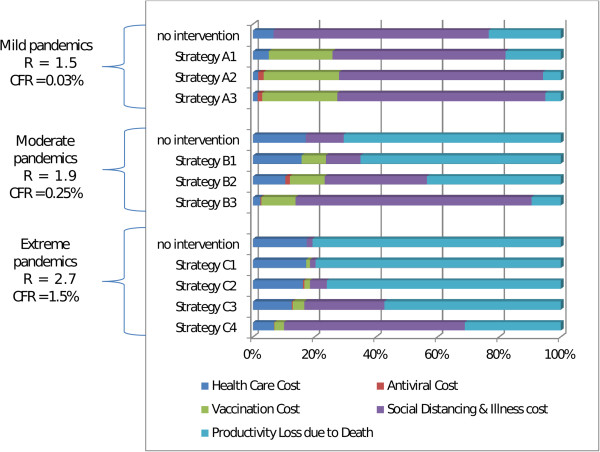
Results: Vaccination-only strategies were not cost effective for any pandemic scenario, saving few lives and incurring substantial vaccination costs. Vaccination coupled with long duration social distancing, antiviral treatment and antiviral prophylaxis was cost effective for moderate pandemics and extreme pandemics, where it saved lives while simultaneously reducing the total pandemic cost. Combined social distancing and antiviral interventions without vaccination were significantly less effective, since without vaccination a resurgence in case numbers occurred as soon as social distancing interventions were relaxed. When social distancing interventions were continued until at least the start of the vaccination campaign, attack rates and total costs were significantly lower, and increased rates of vaccination further improved effectiveness and cost effectiveness.
Conclusions: The effectiveness and cost effectiveness consequences of the time-critical interplay of pandemic dynamics, vaccine availability and intervention timing has been quantified. For moderate and extreme pandemics, vaccination combined with rapidly activated antiviral and social distancing interventions of sufficient duration is cost effective from the perspective of life years saved.
Figures
References
-
- Dawood FS, Iuliano AD, Reed C, Meltzer MI, Shay DK, Cheng PY, Bandaranayake D, Breiman RF, Brooks WA, Buchy P. Estimated global mortality associated with the first 12 months of 2009 pandemic influenza A H1N1 virus circulation: a modelling study. Lancet Infect Dis. 2012;12(9):687–695. doi: 10.1016/S1473-3099(12)70121-4. - DOI - PubMed
-
- Frost W. Statistics of influenza morbidity with special reference to certain factors in case incidence and case fatality. Public Heath Report. 1920;35:584–597. doi: 10.2307/4575511. - DOI
-
- Phillip C. Nature outlook: influenza. Nature. 2011;480(7376 Suppl):S1–S15. - PubMed
MeSH terms
Substances
LinkOut - more resources
Full Text Sources
Other Literature Sources
Medical
