. 2013:4:45-56.
doi: 10.3762/bjnano.4.5. Epub 2013 Jan 21.

Interpreting motion and force for narrow-band intermodulation atomic force microscopy

Affiliations

Interpreting motion and force for narrow-band intermodulation atomic force microscopy

Daniel Platz et al. Beilstein J Nanotechnol. 2013.

Abstract

Intermodulation atomic force microscopy (ImAFM) is a mode of dynamic atomic force microscopy that probes the nonlinear tip-surface force by measurement of the mixing of multiple modes in a frequency comb. A high-quality factor cantilever resonance and a suitable drive comb will result in tip motion described by a narrow-band frequency comb. We show, by a separation of time scales, that such motion is equivalent to rapid oscillations at the cantilever resonance with a slow amplitude and phase or frequency modulation. With this time-domain perspective, we analyze single oscillation cycles in ImAFM to extract the Fourier components of the tip-surface force that are in-phase with the tip motion (F(I)) and quadrature to the motion (F(Q)). Traditionally, these force components have been considered as a function of the static-probe height only. Here we show that F(I) and F(Q) actually depend on both static-probe height and oscillation amplitude. We demonstrate on simulated data how to reconstruct the amplitude dependence of F(I) and F(Q) from a single ImAFM measurement. Furthermore, we introduce ImAFM approach measurements with which we reconstruct the full amplitude and probe-height dependence of the force components F(I) and F(Q), providing deeper insight into the tip-surface interaction. We demonstrate the capabilities of ImAFM approach measurements on a polystyrene polymer surface.

Keywords: AFM; atomic force microscopy; force spectroscopy; frequency combs; high-quality-factor resonators; intermodulation; multifrequency.


Figures

Figure 1
Figure 1
Sketch of the basic experimental setup in narrow-band ImAFM. In the absence of a drive signal the tip is at rest at the static probe height h. The spectrum of the drive comb consists of two frequency components spaced by Δω and centered at the first flexural resonance frequency ω0 of the cantilever, which is much higher than the comb base frequency Δω (here ω0 = 600 × Δω). The driven tip oscillates with amplitude A and interacts with the sample surface. The instantaneous tip position z is measured in the rest frame of the sample surface. The corresponding deflection signal is detected by an optical lever system and is concentrated to a narrow band around ω0, as the drive signal. In this band, new frequency components spaced by Δω are present, which are generated by the nonlinear tip–sample interaction Fts. Outside the narrow band at ω0 there is only a small response in bands at integer multiples of ω0.
Figure 2
Figure 2
The amplitude spectrum of a narrow band signal as a function of the Fourier index (a) is characterized by a finite number of Fourier components in a frequency band around the center frequency formula image = formula imageΔω, in a bandwidth that is given by the integer number ΔN. The spectrum of the corresponding time-dependent envelope function (b) is obtained by down-shifting the original spectrum in frequency space such that the shifted center frequency is zero.
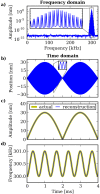
Figure 3
Figure 3
(a) The amplitude spectrum of an amplitude and frequency modulated signal. The response is concentrated in a narrow-band frequency comb with a center frequency much higher than the comb base frequency. In the time domain (b) the signal rapidly oscillates on a short time scale and the slow amplitude modulation is clearly visible. The time-dependent amplitude (c) and frequency (d) reconstructed from the envelope function are in excellent agreement with the actual modulation used for the signal generation in the time domain.
Figure 4
Figure 4
Sketch of a narrow-band signal. On the slow time scale Tslow the tip motion shows an amplitude modulation. On the fast time scale Tfast the signal rapidly oscillates. During each oscillation cycle the tip interacts with the surface for the time Tinter during which the oscillation amplitude and phase are approximately constant.
Figure 5
Figure 5
The FI(A) and FQ(A) curves reconstructed from simulated tip motion in ImAFM. The reconstructed curves are in good agreement with the actual curves directly determined from the model force used in the simulations.
Figure 6
Figure 6
Model FI(h,A) and FQ(h,A) maps for the vdW-DMT force with exponential damping introduced in Equation 40. The displayed measurement paths correspond to a frequency-shift–distance curve in FM-AFM, an amplitude–phase–distance curve in AM-AFM and an ImAFM measurement. In contrast to FM-AFM and AM-AFM, the static probe height is constant during an ImAFM measurement and the hA plane is explored along a path parallel to the A axis. One should also note the amplitude jump along the AM-AFM path at a probe height of h = 30 nm.
Figure 7
Figure 7
FI(h,A) and FQ(h,A) maps reconstructed from an ImAFM approach measurements on a PS surface. The z-piezo extension corresponds to a relative change of the probe height h above the sample surface.

References

    1. Binnig G, Quate C F, Gerber C. Phys Rev Lett. 1986;56:930–933. doi: 10.1103/PhysRevLett.56.930. - DOI - PubMed
    1. Ohnesorge F, Binnig G. Science. 1993;260:1451–1456. doi: 10.1126/science.260.5113.1451. - DOI - PubMed
    1. Giessibl F J. Science. 1995;267:68–71. doi: 10.1126/science.267.5194.68. - DOI - PubMed
    1. Hansma P K, Cleveland J P, Radmacher M, Walters D A, Hillner P E, Bezanilla M, Fritz M, Vie D, Hansma H G, Prater C B, et al. Appl Phys Lett. 1994;64:1738–1741. doi: 10.1063/1.111795. - DOI
    1. Rugar D, Yannoni C S, Sidles J A. Nature. 1992;360:563–566. doi: 10.1038/360563a0. - DOI