

α3Na+/K+-ATPase deficiency causes brain ventricle dilation and abrupt embryonic motility in zebrafish
- PMID: 23400780
- PMCID: PMC3610961
- DOI: 10.1074/jbc.M112.421529
α3Na+/K+-ATPase deficiency causes brain ventricle dilation and abrupt embryonic motility in zebrafish
Abstract
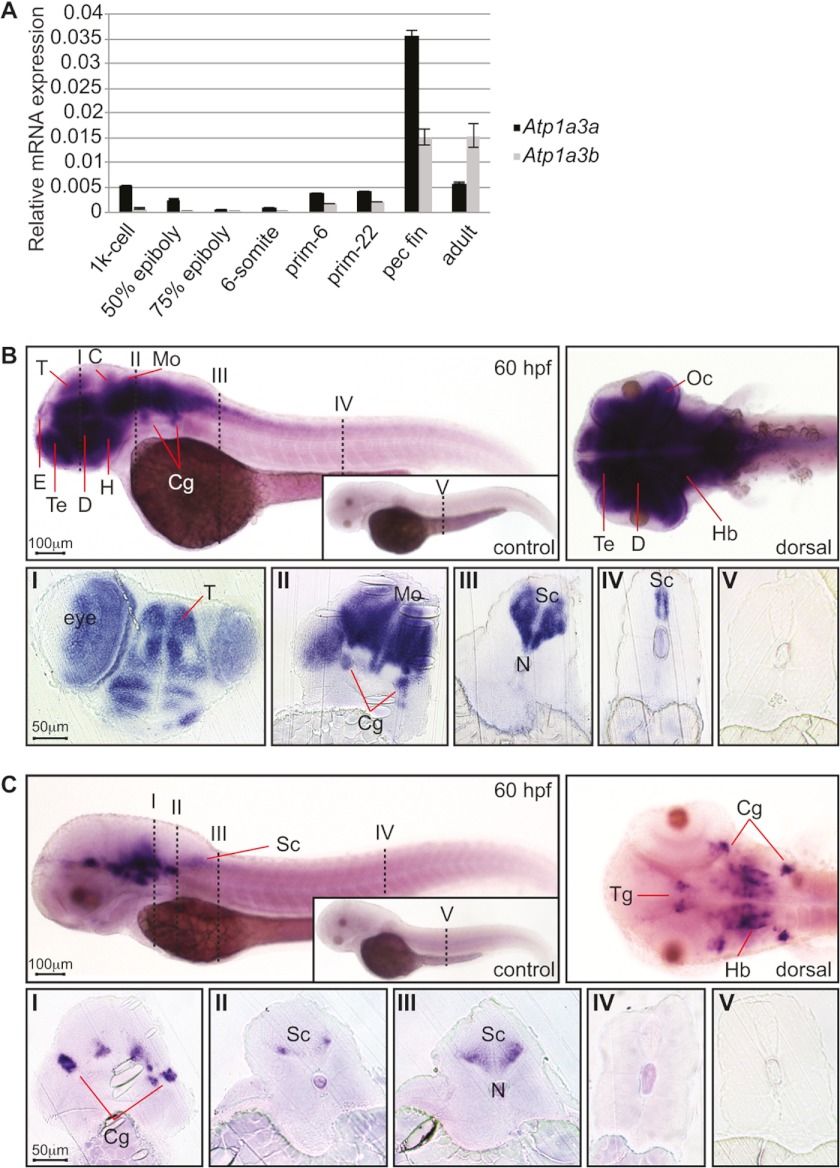
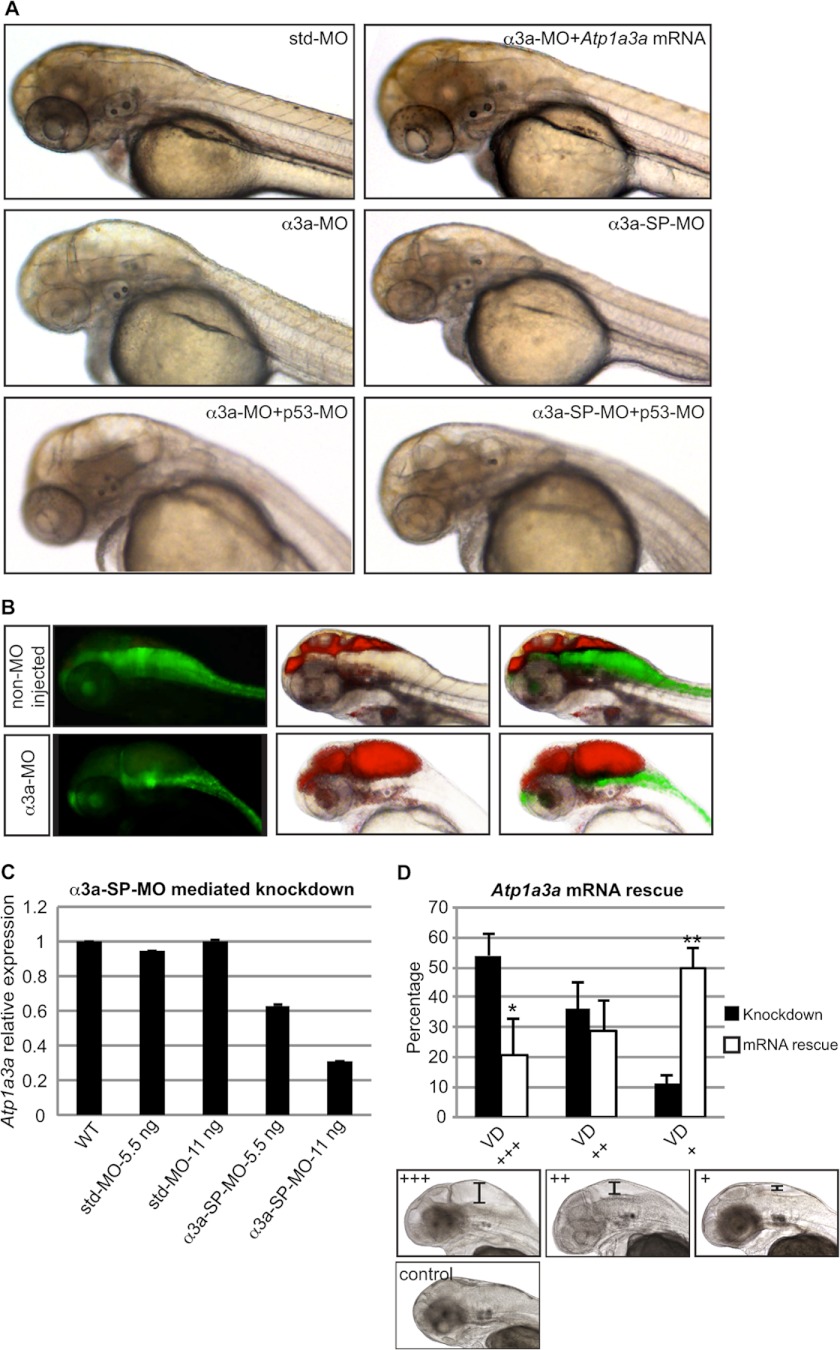
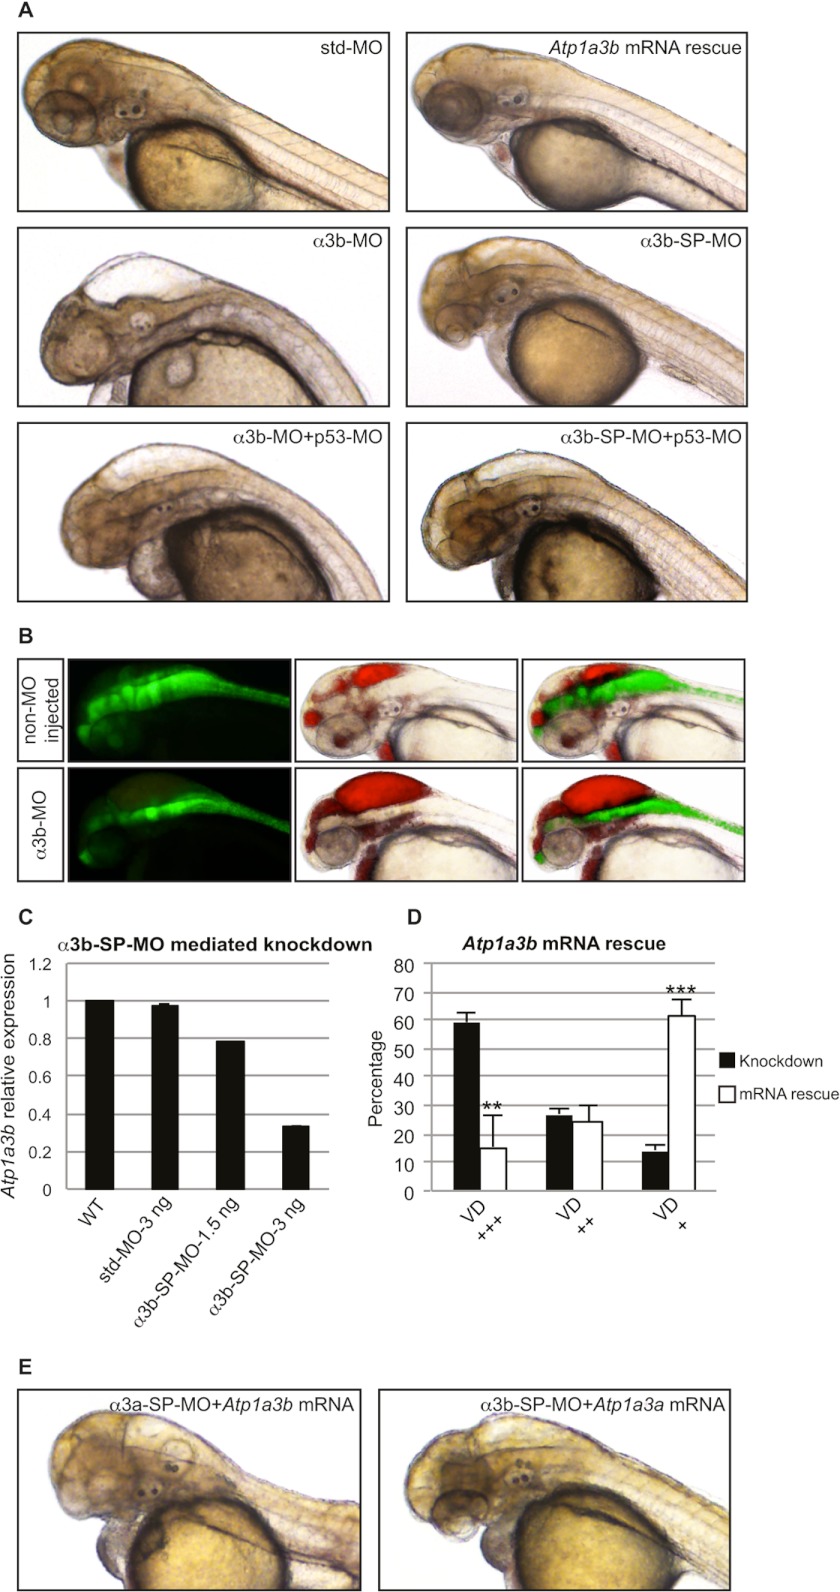
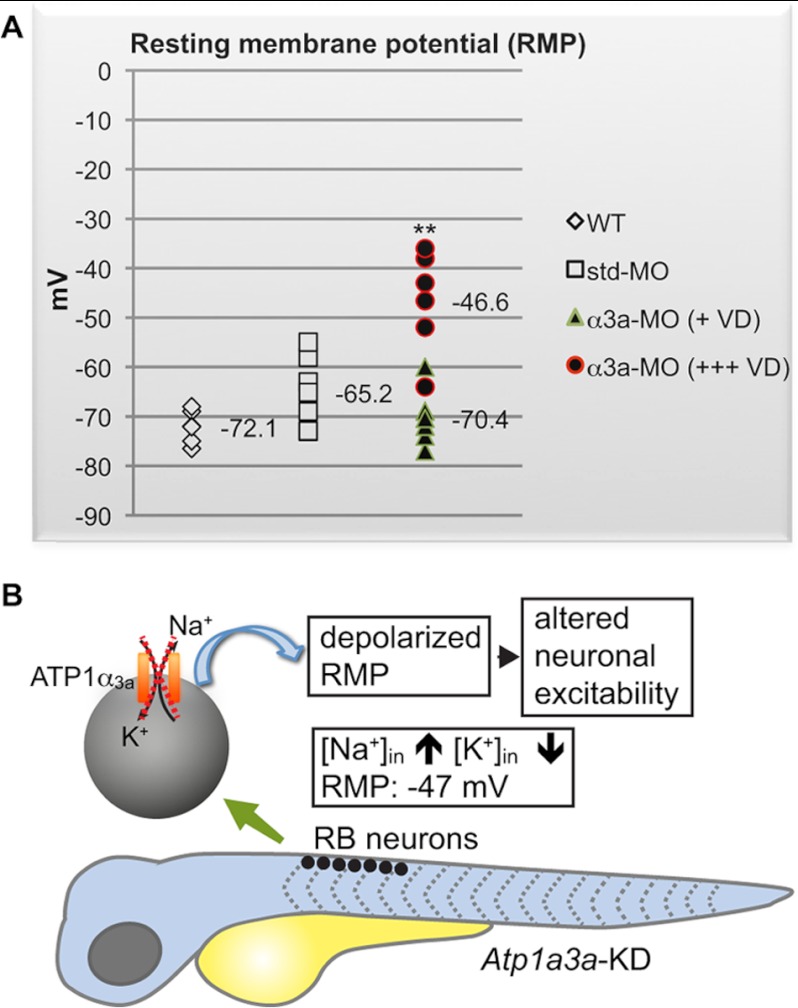
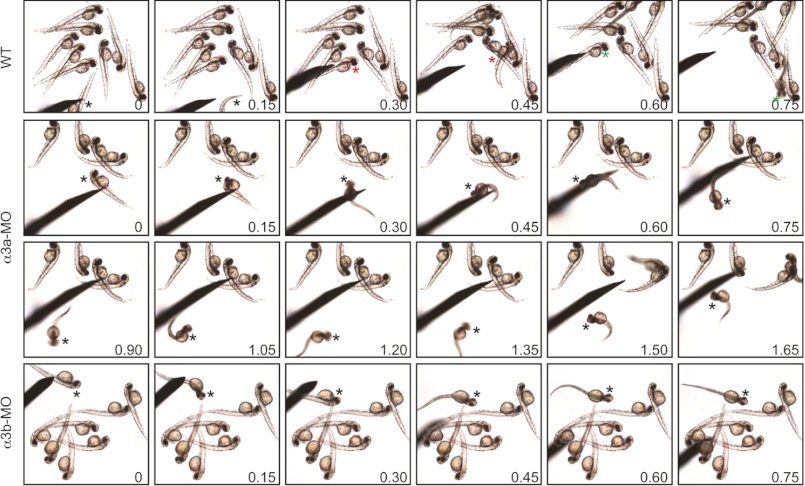
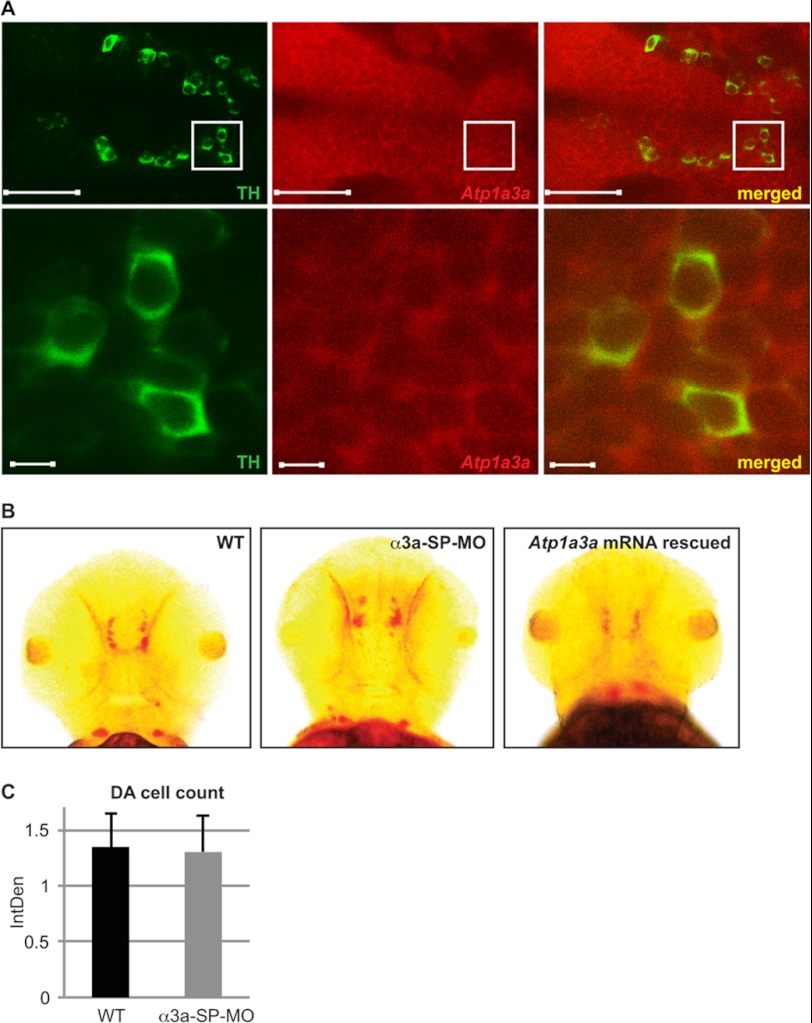
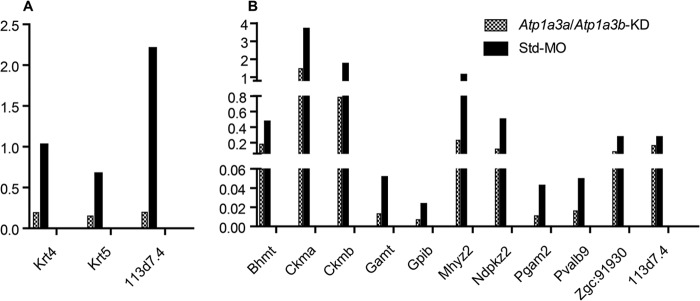
Na(+)/K(+)-ATPases are transmembrane ion pumps that maintain ion gradients across the basolateral plasma membrane in all animal cells to facilitate essential biological functions. Mutations in the Na(+)/K(+)-ATPase α3 subunit gene (ATP1A3) cause rapid-onset dystonia-parkinsonism, a rare movement disorder characterized by sudden onset of dystonic spasms and slow movements. In the brain, ATP1A3 is principally expressed in neurons. In zebrafish, the transcripts of the two ATP1A3 orthologs, Atp1a3a and Atp1a3b, show distinct expression in the brain. Surprisingly, targeted knockdown of either Atp1a3a or Atp1a3b leads to brain ventricle dilation, a likely consequence of ion imbalances across the plasma membrane that cause accumulation of cerebrospinal fluid in the ventricle. The brain ventricle dilation is accompanied by a depolarization of spinal Rohon-Beard neurons in Atp1a3a knockdown embryos, suggesting impaired neuronal excitability. This is further supported by Atp1a3a or Atp1a3b knockdown results where altered responses to tactile stimuli as well as abnormal motility were observed. Finally, proteomic analysis identified several protein candidates highlighting proteome changes associated with the knockdown of Atp1a3a or Atp1a3b. Our data thus strongly support the role of α3Na(+)/K(+)-ATPase in zebrafish motility and brain development, associating for the first time the α3Na(+)/K(+)-ATPase deficiency with brain ventricle dilation.
Figures
Similar articles
-
Zebrafish as a novel model to assess Na+/K(+)-ATPase-related neurological disorders.Neurosci Biobehav Rev. 2013 Dec;37(10 Pt 2):2774-87. doi: 10.1016/j.neubiorev.2013.09.013. Epub 2013 Oct 1. Neurosci Biobehav Rev. 2013. PMID: 24091024 Review.
-
Multiple roles for the Na,K-ATPase subunits, Atp1a1 and Fxyd1, during brain ventricle development.Dev Biol. 2012 Aug 15;368(2):312-22. doi: 10.1016/j.ydbio.2012.05.034. Epub 2012 Jun 7. Dev Biol. 2012. PMID: 22683378 Free PMC article.
-
Molecular cloning and characterization of porcine Na⁺/K⁺-ATPase isoforms α1, α2, α3 and the ATP1A3 promoter.PLoS One. 2013 Nov 13;8(11):e79127. doi: 10.1371/journal.pone.0079127. eCollection 2013. PLoS One. 2013. PMID: 24236096 Free PMC article.
-
The α2Na+/K+-ATPase is critical for skeletal and heart muscle function in zebrafish.J Cell Sci. 2012 Dec 15;125(Pt 24):6166-75. doi: 10.1242/jcs.115808. Epub 2012 Oct 24. J Cell Sci. 2012. PMID: 23097043
-
Cell biology and dynamics of Neuronal Na+/K+-ATPase in health and diseases.Neuropharmacology. 2020 Jun 1;169:107461. doi: 10.1016/j.neuropharm.2018.12.008. Epub 2018 Dec 11. Neuropharmacology. 2020. PMID: 30550795 Review.
Cited by
-
Neural innervation as a potential trigger of morphological color change and sexual dimorphism in cichlid fish.Sci Rep. 2020 Jul 23;10(1):12329. doi: 10.1038/s41598-020-69239-w. Sci Rep. 2020. PMID: 32704058 Free PMC article.
-
Recessive Inheritance of Congenital Hydrocephalus With Other Structural Brain Abnormalities Caused by Compound Heterozygous Mutations in ATP1A3.Front Cell Neurosci. 2019 Sep 26;13:425. doi: 10.3389/fncel.2019.00425. eCollection 2019. Front Cell Neurosci. 2019. PMID: 31616254 Free PMC article.
-
Efficient disruption of Zebrafish genes using a Gal4-containing gene trap.BMC Genomics. 2013 Sep 14;14:619. doi: 10.1186/1471-2164-14-619. BMC Genomics. 2013. PMID: 24034702 Free PMC article.
-
Distinct neurological disorders with ATP1A3 mutations.Lancet Neurol. 2014 May;13(5):503-14. doi: 10.1016/S1474-4422(14)70011-0. Lancet Neurol. 2014. PMID: 24739246 Free PMC article. Review.
-
Development of brain ventricular system.Cell Mol Life Sci. 2018 Feb;75(3):375-383. doi: 10.1007/s00018-017-2605-y. Epub 2017 Aug 5. Cell Mol Life Sci. 2018. PMID: 28780589 Free PMC article. Review.
References
-
- Blanco G. (2005) Na,K-ATPase subunit heterogeneity as a mechanism for tissue-specific ion regulation. Semin. Nephrol. 25, 292–303 - PubMed
-
- Kaplan J. H. (2002) Biochemistry of Na,K-ATPase. Annu. Rev. Biochem. 71, 511–535 - PubMed
-
- Lingrel J., Moseley A., Dostanic I., Cougnon M., He S., James P., Woo A., O'Connor K., Neumann J. (2003) Functional roles of the α isoforms of the Na,K-ATPase. Ann. N.Y. Acad. Sci. 986, 354–359 - PubMed
-
- Lingrel J. B., Kuntzweiler T. (1994) Na+,K+-ATPase. J. Biol. Chem. 269, 19659–19662 - PubMed
Publication types
MeSH terms
Substances
Grants and funding
LinkOut - more resources
Full Text Sources
Other Literature Sources
Molecular Biology Databases
