. 2013 Apr;69(4):966-73.
doi: 10.1002/mrm.24655. Epub 2013 Feb 11.

Imaging of endogenous exchangeable proton signals in the human brain using frequency labeled exchange transfer imaging

Affiliations

Imaging of endogenous exchangeable proton signals in the human brain using frequency labeled exchange transfer imaging

Nirbhay N Yadav et al. Magn Reson Med. 2013 Apr.

Abstract

Purpose: To image endogenous exchangeable proton signals in the human brain using a recently reported method called frequency labeled exchange transfer (FLEX) MRI.

Methods: As opposed to labeling exchangeable protons using saturation (i.e., chemical exchange saturation transfer, or CEST), FLEX labels exchangeable protons with their chemical shift evolution. The use of short high-power frequency pulses allows more efficient labeling of rapidly exchanging protons, while time domain acquisition allows removal of contamination from semi-solid magnetization transfer effects.

Results: FLEX-based exchangeable proton signals were detected in human brain over the 1-5 ppm frequency range from water. Conventional magnetization transfer contrast and the bulk water signal did not interfere in the FLEX spectrum. The information content of these signals differed from in vivo CEST data in that the average exchange rate of these signals was 350-400 s(-1) , much faster than the amide signal usually detected using direct saturation (∼30 s(-1) ). Similarly, fast exchanging protons could be detected in egg white in the same frequency range where amide and amine protons of mobile proteins and peptides are known to resonate.

Conclusions: FLEX MRI in the human brain preferentially detects more rapidly exchanging amide/amine protons compared to traditional CEST experiments, thereby changing the information content of the exchangeable proton spectrum. This has the potential to open up different types of endogenous applications as well as more easy detection of rapidly exchanging protons in diaCEST agents or fast exchanging units such as water molecules in paracest agents without interference of conventional magnetization transfer contrast.


Figures

Figure 1
Figure 1
(a) Phase sensitive FLEX pulse sequence used for labeling solute protons and, after the labeled protons exchange into the water pool, detecting them via an MRI readout of water. Solute proton labeling and subsequent transfer to water occurs during label transfer modules (LTMs), each containing of a pair of 90°φ1/90°φ2 excitation pulses separated by a delay tevol that is used to encode the chemical shift evolution of the solute spin ensembles. This is a function of the chemical shift difference between the solute resonance frequency and the offset frequency of the excitation pulses (o1). Following the labeling segment is a delay, texch, during which labeled solute protons exchange into the water pool. The net effect from a single LTM is usually insufficient since the solute pool is much smaller than the water pool, however, as a result of this, the labeled protons which exchange into the water pool are likely to be replaced by unlabeled protons from water, and a subsequent LTM, with the same parameters repeats the FLEX process. Each LTM is repeated n times to enhance the effect on water. tevol is varied for a number of different acquisitions, using a constant time (T) approach, to modulate the water signal intensity, thus allowing the deconvolution of the FLEX signal to extract the contributions for separate spin ensembles with different frequency. The phase of the excitation pulses is cycled (φ1 = x,y,−x,−y2 = −x,−y,x,y for cosine component; φ1 = x,y,−x,−y2 = y,−x,−y,x for sine component) between LTMs to minimize stimulated echoes. (b) Excitation profile for a pair of rectangular-shaped 1 ms 90° excitation pulses placed 968 Hz (7.6 ppm at 3 T) away from the water resonance. At 3.6 ppm from the water resonance (shaded region indicating the maximum signal of the composite amide proton resonance), the excitation efficiency is 0.8.
Figure 2
Figure 2
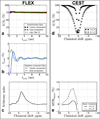
Off-resonance FLEX (20 ms LTMs) and CEST results from an egg white phantom. The low frequency fit in a is subtracted from the experimental data to obtain the FLEX time domain signal (b), which shows that the magnitude of the FLEX effect is up to 2% of the water signal, equivalent to ~2 M. The hypercomplex data in b is then Fourier transformed to get a FLEX spectrum (c), which shows a significant peak at ~ 4 ppm. Processing the CEST spectrum (d) using asymmetry analysis, there is a CEST peak at ~3 ppm. The magnitude of this peak also is approximately 2% of the water signal for a 1 µT saturation pulse and 10% of the water signal for a 4.7 µT pulse.
Figure 3
Figure 3
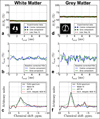
Off-resonance FLEX results for the human brain. In white matter (a–c), a significant signal is detected that corresponds to a composite peak at ~4 ppm from water. In grey matter (d–f), the same signal is detected but with a larger amplitude. The location of these peaks correspond to the APT signal seen in CEST experiments however the decay rates (400 s−1) indicate the protons detected by FLEX are exchanging more rapidly than those detected using APT. FLEX data is quantified using the time domain data (b,e) and a Fourier transform of the fitted parameters is shown in c,e (dotted lines). Note that although d–f is primarily from grey matter; due to the nature of the mask, there will be possible contributions form CSF.
Figure 4
Figure 4
Left: FLEX baseline offset map showing the reduction in the bulk water signal as a result of dephasing between the FLEX labeling pulses. While this resembles a conventional MTC map with white matter signal lower than gray matter, there may also be contributions from mobile macromolecular components that have a short T2*. Right: Fitted FLEX PTR map of the APT component. The PTR was obtained by fitting Eq. 2 to the cosine component of the experimental data.
Figure 5
Figure 5
Comparison of FLEX spectra acquired using either 10 ms or 20 ms LTMs. The FLEX spectrum can be weighted towards fast or slow exchange processes depending on how much time is given to labeled protons to exchange into the water pool. Using a 20 ms LTM, NOE-relayed signal from aliphatic protons is observed in the exchange spectra at ~4 ppm but these are mostly filtered out using a 10 ms LTM.

References

    1. Sun PZ, Zhou J, Sun W, Huang J, van Zijl PCM. Detection of the ischemic penumbra using pH-weighted MRI. J Cereb Blood Flow Metab. 2007;27:1129–1136. - PubMed
    1. Zhou J, Payen JF, Wilson DA, Traystman RJ, van Zijl PCM. Using the amide proton signals of intracellular proteins and peptides to detect pH effects in MRI. Nat Med. 2003;9:1085–1090. - PubMed
    1. Ward K, Balaban R. Determination of pH using water protons and chemical exchange dependent saturation transfer (CEST) Magn Reson Med. 2000;44:799–802. - PubMed
    1. Liu G, Li Y, Sheth VR, Pagel MD. Imaging in vivo extracellular pH with a single paramagnetic chemical exchange saturation transfer magnetic resonance imaging contrast agent. Mol Imaging. 2012;11:47–57. - PMC - PubMed
    1. Delli-Castelli D, Terreno E, Aime S. Ybiii-HPDO3A: A dual pH-and temperature-responsive CEST agent. Angew Chem Int Ed. 2011;50:1798–1800. - PubMed

Publication types

MeSH terms