

Effects of developmental deltamethrin exposure on white adipose tissue gene expression
- PMID: 23401056
- PMCID: PMC4034683
- DOI: 10.1002/jbt.21477
Effects of developmental deltamethrin exposure on white adipose tissue gene expression
Erratum in
- J Biochem Mol Toxicol. 2013 Apr;27(4):251-2
Abstract
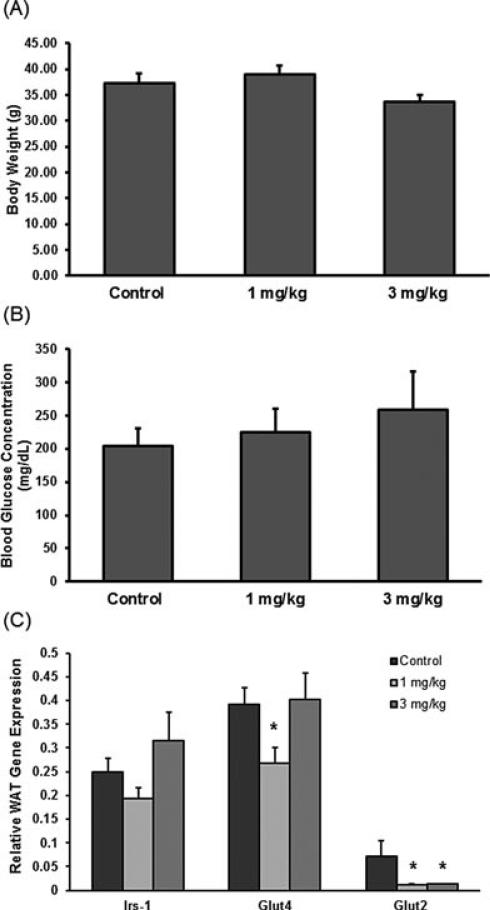
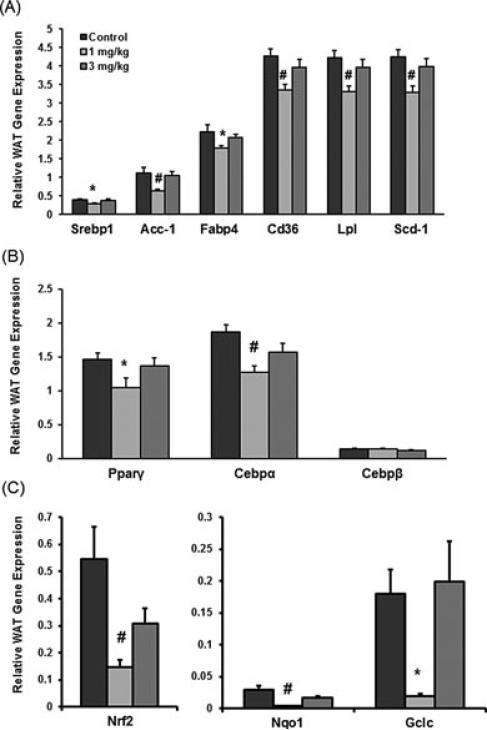
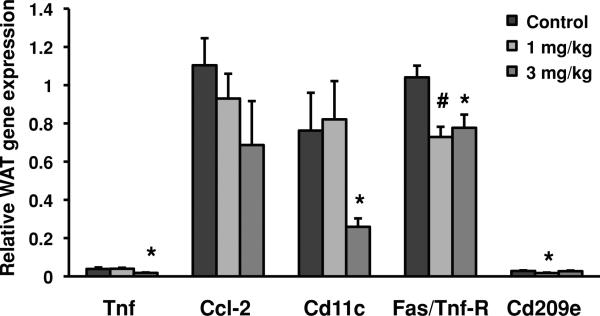
Deltamethrin, a type II pyrethroid, is a widely used insecticide. The purpose of this study was to determine whether perinatal deltamethrin exposure altered the expression of adipogenic and lipogenic genes in white adipose tissue (WAT) in adult pups. C57BL/6 pregnant mice were administered 0, 1, or 3 mg/kg of deltamethrin orally every 3 days throughout gestation and lactation. Offspring were weaned on postnatal day 25, and WAT was collected from 5-month-old male mice. Perinatal deltamethrin exposure decreased the mRNA expression of adipogenesis-related transcription factors Pparγ, Cebpα, and lipogenic genes Srebp1c, Acc-1, Cd36, Lpl, Scd-1; along with Nrf2 and target genes Nqo1 and Gclc at the 1 mg/kg treatment. Cytokine expression of Fas/Tnf-R and Cd209e at the 1 mg/kg treatment was significantly decreased, and expression of Tnf, Cd11c, and Fas/Tnf-R was decreased at the 3 mg/kg treatment. Developmental deltamethrin exposure did not overtly affect body weight or adipose weight, but decreased mRNA expression of specific genes that may potentially disrupt normal adipogenesis and lipid and glucose metabolism if the offspring are challenged by changes in diet or environment.
© 2013 Wiley Periodicals, Inc.
Figures
Similar articles
-
Developmental pyrethroid exposure causes long-term decreases of neuronal sodium channel expression.Neurotoxicology. 2017 May;60:274-279. doi: 10.1016/j.neuro.2016.04.002. Epub 2016 Apr 4. Neurotoxicology. 2017. PMID: 27058123 Free PMC article.
-
Perinatal exposure to bisphenol a alters early adipogenesis in the rat.Environ Health Perspect. 2009 Oct;117(10):1549-55. doi: 10.1289/ehp.11342. Epub 2009 Jun 29. Environ Health Perspect. 2009. PMID: 20019905 Free PMC article.
-
Forced catch-up growth after fetal protein restriction alters the adipose tissue gene expression program leading to obesity in adult mice.Am J Physiol Regul Integr Comp Physiol. 2009 Aug;297(2):R291-9. doi: 10.1152/ajpregu.90497.2008. Epub 2009 May 20. Am J Physiol Regul Integr Comp Physiol. 2009. PMID: 19458276
-
Developmental Deltamethrin Exposure Causes Persistent Changes in Dopaminergic Gene Expression, Neurochemistry, and Locomotor Activity in Zebrafish.Toxicol Sci. 2015 Aug;146(2):235-43. doi: 10.1093/toxsci/kfv087. Epub 2015 Apr 24. Toxicol Sci. 2015. PMID: 25912032 Free PMC article.
-
Deltamethrin toxicity: A review of oxidative stress and metabolism.Environ Res. 2019 Mar;170:260-281. doi: 10.1016/j.envres.2018.12.045. Epub 2018 Dec 21. Environ Res. 2019. PMID: 30599291 Review.
Cited by
-
Potential contribution of insecticide exposure and development of obesity and type 2 diabetes.Food Chem Toxicol. 2017 Jul;105:456-474. doi: 10.1016/j.fct.2017.05.003. Epub 2017 May 6. Food Chem Toxicol. 2017. PMID: 28487232 Free PMC article. Review.
-
Developmental pyrethroid exposure in mouse leads to disrupted brain metabolism in adulthood.bioRxiv [Preprint]. 2024 May 28:2023.10.13.562226. doi: 10.1101/2023.10.13.562226. bioRxiv. 2024. Update in: Neurotoxicology. 2024 Jul;103:87-95. doi: 10.1016/j.neuro.2024.06.007. PMID: 37961675 Free PMC article. Updated. Preprint.
-
Developmental pyrethroid exposure in mouse leads to disrupted brain metabolism in adulthood.Neurotoxicology. 2024 Jul;103:87-95. doi: 10.1016/j.neuro.2024.06.007. Epub 2024 Jun 12. Neurotoxicology. 2024. PMID: 38876425 Free PMC article.
-
Prenatal exposure to insecticides and child cardiometabolic risk factors in the VHEMBE birth cohort.Environ Epidemiol. 2022 Feb 11;6(2):e196. doi: 10.1097/EE9.0000000000000196. eCollection 2022 Apr. Environ Epidemiol. 2022. PMID: 35434465 Free PMC article.
-
Developmental pyrethroid exposure causes long-term decreases of neuronal sodium channel expression.Neurotoxicology. 2017 May;60:274-279. doi: 10.1016/j.neuro.2016.04.002. Epub 2016 Apr 4. Neurotoxicology. 2017. PMID: 27058123 Free PMC article.
References
-
- Ray DE, Fry JR. A reassessment of the neurotoxicity of pyrethroid insecticides. Pharmacol Ther. 2006;111(1):174–193. - PubMed
-
- Soderlund DM, Clark JM, Sheets LP, Mullin LS, Piccirillo VJ, Sargent D, Stevens JT, Weiner ML. Mechanisms of pyrethroid neurotoxicity: implications for cumulative risk assessment. Toxicology. 2002;171(1):3–59. - PubMed
-
- Sheets LP. A consideration of age-dependent differences in susceptibility to organophosphorus and pyrethroid insecticides. Neurotoxicology. 2000;21(1–2):57–63. - PubMed
Publication types
MeSH terms
Substances
Grants and funding
- R01 ES020522/ES/NIEHS NIH HHS/United States
- T32 ES007148/ES/NIEHS NIH HHS/United States
- P20 GM103430/GM/NIGMS NIH HHS/United States
- P30 ES005022/ES/NIEHS NIH HHS/United States
- P20GM103430/GM/NIGMS NIH HHS/United States
- 5P20RR016457/RR/NCRR NIH HHS/United States
- 5K22ES013782/ES/NIEHS NIH HHS/United States
- R01ES015991/ES/NIEHS NIH HHS/United States
- K22 ES013782/ES/NIEHS NIH HHS/United States
- R01 ES016042/ES/NIEHS NIH HHS/United States
- T32ES007148/ES/NIEHS NIH HHS/United States
- P20 RR016457/RR/NCRR NIH HHS/United States
- 4R01ES016042/ES/NIEHS NIH HHS/United States
- R01 ES015991/ES/NIEHS NIH HHS/United States
- P30ES005022/ES/NIEHS NIH HHS/United States
LinkOut - more resources
Full Text Sources
Other Literature Sources
Research Materials
Miscellaneous
