Multicenter Study
. 2013 May;65(5):1324-34.
doi: 10.1002/art.37890.

Circulating microRNA expression profiles associated with systemic lupus erythematosus

Affiliations
Multicenter Study

Circulating microRNA expression profiles associated with systemic lupus erythematosus

Anting Liu Carlsen et al. Arthritis Rheum. 2013 May.

Abstract

Objective: To evaluate the specificity of expression patterns of cell-free circulating microRNAs (miRNAs) in systemic lupus erythematosus (SLE).

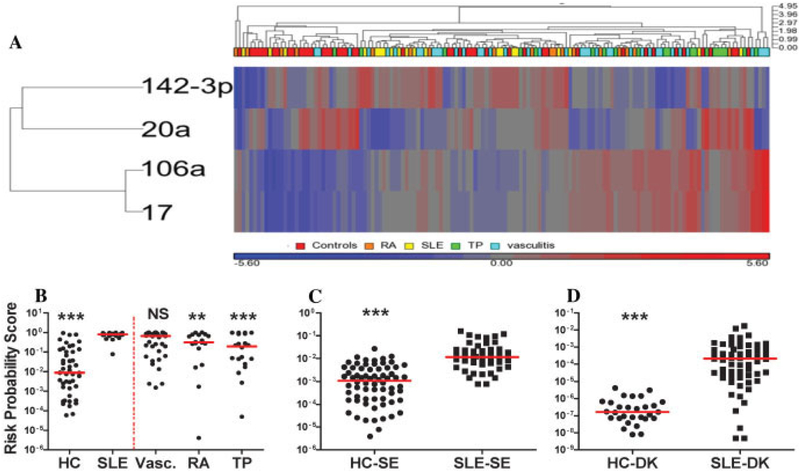
Methods: Total RNA was purified from plasma, and 45 different specific, mature miRNAs were determined using quantitative reverse transcription-polymerase chain reaction assays. A total of 409 plasma samples were obtained from 364 different patients with SLE, healthy control subjects, and control subjects with other autoimmune diseases. The results in the primary cohort of 62 patients with SLE and 29 healthy control subjects were validated in 2 independent cohorts: a validation cohort comprising 68 patients with SLE and 68 healthy control subjects, and a disease control cohort comprising 20 patients with SLE (19 of whom were from the other validation cohort), 46 healthy control subjects, 38 patients with vasculitis, 18 patients with rheumatoid arthritis, and 20 immunosuppressed patients.

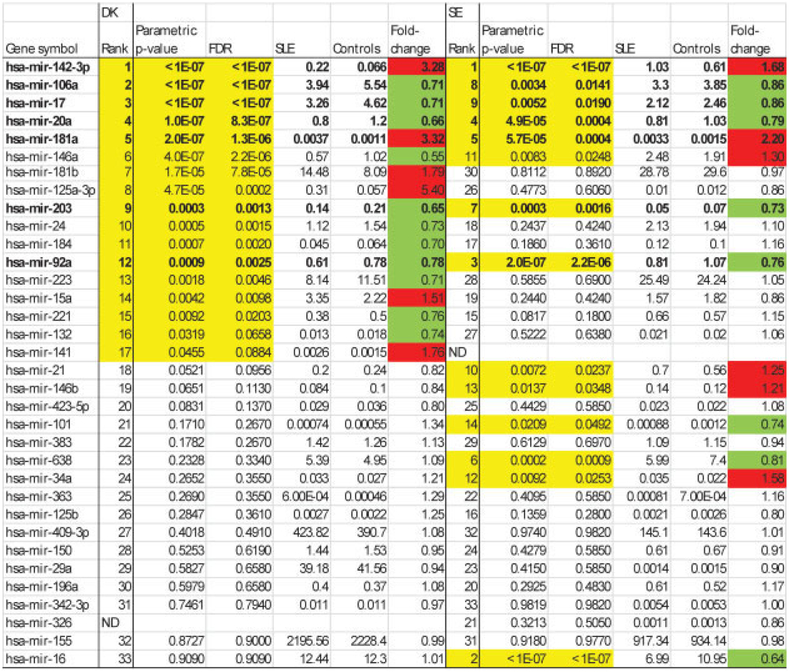
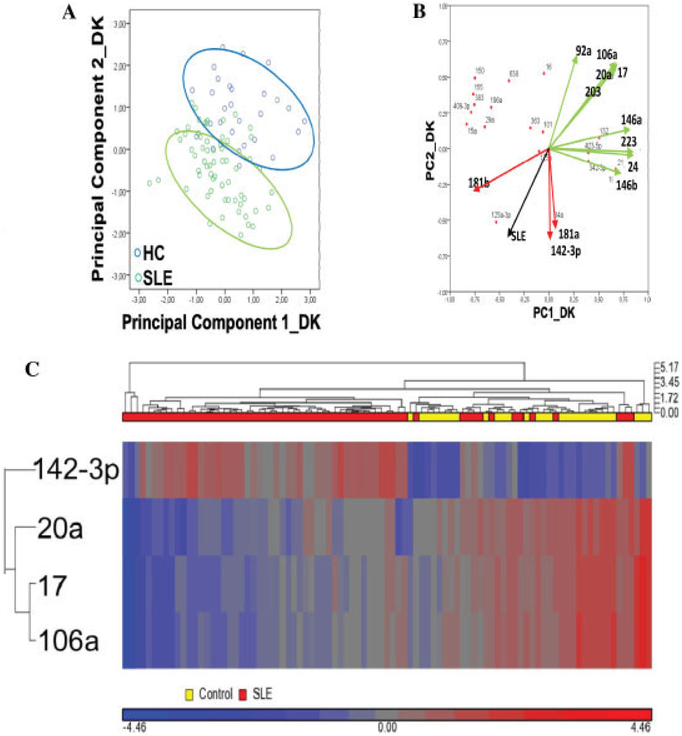
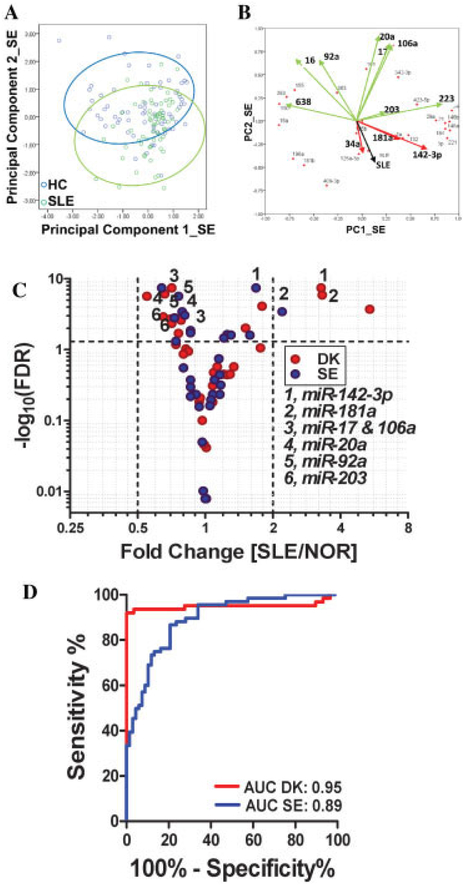
Results: Seven miRNAs were statistically significantly differentially expressed in plasma from patients with SLE. The expression of miRNA-142-3p (miR-142-3p) and miR-181a was increased, and the expression of miR-106a, miR-17, miR-20a, miR-203, and miR-92a was decreased. In addition, the expression of miR-342-3p, miR-223, and miR-20a was significantly decreased in SLE patients with active nephritis. A predictive model for SLE based on 2 or 4 miRNAs differentiated patients with SLE from control subjects (76% accuracy) when validated independently (P < 2 × 10(-9) ). Use of the 4-miRNA model provided highly significant differentiation between the SLE group and disease controls, except for those with vasculitis.

Conclusion: Circulating miRNAs are systematically altered in SLE. A 4-miRNA signature was diagnostic of SLE, and a specific subset of miRNA profiles was associated with nephritis. All of the signature miRNAs target genes in the transforming growth factor β signaling pathways. Other targets include regulation of apoptosis, cytokine-cytokine receptors, T cell development, and cytoskeletal organization. These findings highlight possible dysregulated pathways in SLE and suggest that circulating miRNA patterns distinguish SLE from other immunoinflammatory phenotypes.


Figures

Figure 1.
Figure 1.
MicroRNA (miRNA) expression in the exploratory (Danish; DK) and validation (Swedish; SE) cohorts, ranked according to P values for univariate testing in the Danish cohort. Values in the columns headed SLE and Controls are the geometric means of ratios. The fold change is the ratio of expression in patients with systemic lupus erythematosus (SLE) versus controls. All P values less than 0.05 are shown in yellow. The red highlighting indicates significant up-regulation, and the green highlighting indicates significant down-regulation. The 7 miRNAs that were consistently differentially regulated in the 2 cohorts are shown in boldface. FDR = false-discovery rate; ND = not detected.
Figure 2.
Figure 2.
Expression of plasma miRNAs in the exploratory (Danish) cohort. A, Diagram of principal components analysis, showing the distribution of patients with SLE and healthy controls (HCs) according to the first 2 principal components (PC1 and PC2). B, Loadings plot showing the contribution of individual miRNAs to PC1 and PC2. Significantly down-regulated miRNAs are shown in green, and significantly up-regulated miRNAs are shown in red (see Figure 1). The black vector shows the PC variation with regard to having/not having SLE. C, Unsupervised hierarchical clustering based on expression of the 4 top-performing miRNAs. Data are scaled to mean = 0 and SD = 1 to enable comparison across miRNAs. See Figure 1 for other definitions.
Figure 3.
Figure 3.
Expression of plasma microRNAs (miRNAs; miR) in the validation (Swedish; SE) cohort and comparison with the exploratory cohort. A, Diagram of principal components analysis, showing partial differentiation between patients with systemic lupus erythematosus (SLE) and healthy controls. B, Loadings plot showing the contribution of individual miRNAs to PC1 and PC2. Significantly down-regulated miRNAs are shown in green, and significantly up-regulated miRNAs are shown in red. The black vector shows the PC variation with regard to having/not having SLE. C, Volcano plot showing the expression of 33 miRNAs in plasma in the Danish (DK) and SE cohorts. The 7 numbered miRNAs are those that were consistently and significantly changed in the DK and the SE cohorts. The broken horizontal line corresponds to a false discovery rate (FDR) of 0.05. D, Receiver operating characteristic curves (plots of true-positive versus false-positive rate for different cutoffs of the test) for the DK and SE cohorts, using the difference between the change in quantification cycle values for miR-106a and miR-142–3p as a classifier. NOR = normal; AUC = area under the curve (see Figure 2 for other definitions).
Figure 4.
Figure 4.
Expression of miRNAs and risk probability scores in patients with SLE and disease controls. A, Unsupervised hierarchical clustering using the 4 top-performing miRNAs from the exploratory and validation cohorts, healthy controls (HCs), patients with SLE, patients with vasculitis (Vasc.), patients with rheumatoid arthritis (RA), and kidney transplant recipients (TP). B-D, Risk probability scores, derived after applying a logistic regression model based on the 4 top-performing miRNAs in the SLE/HC samples in the disease control sample set (left of the broken red line in B). B, Disease controls training set. C, Swedish cohort (19 healthy controls were removed because they were used in the data set shown in B). D, Danish cohort. Symbols represent individual data points; horizontal lines show the mean. ** = P < 0.01; *** = P < 0.001 versus SLE. NS = not significant (see Figure 3 for other definitions).

Similar articles

Cited by

References

    1. Ronnblom L, Alm GV, Eloranta ML. Type I interferon and lupus. Curr Opin Rheumatol 2009;21:471–7. - PubMed
    1. Santer DM, Wiedeman AE, Teal TH, Ghosh P, Elkon KB. Plasmacytoid dendritic cells and C1q differentially regulate inflammatory gene induction by lupus immune complexes. J Immunol 2012;188:902–15. - PMC - PubMed
    1. Baechler EC, Gregersen PK, Behrens TW. The emerging role of interferon in human systemic lupus erythematosus. Curr Opin Immunol 2004;16:801–7. - PubMed
    1. Bauer JW, Baechler EC, Petri M, Batliwalla FM, Crawford D, Ortmann WA, et al. Elevated serum levels of interferon-regulated chemokines are biomarkers for active human systemic lupus erythematosus. PLoS Med 2006;3:e491. - PMC - PubMed
    1. Eloranta ML, Lovgren T, Finke D, Mathsson L, Ronnelid J, Kastner B, et al. Regulation of the interferon-α production induced by RNA-containing immune complexes in plasmacytoid dendritic cells. Arthritis Rheum 2009;60:2418–27. - PubMed

Publication types

MeSH terms