

Review
doi: 10.1503/cmaj.120592.
Epub 2013 Feb 11.
Adjustment for continuous confounders: an example of how to prevent residual confounding
Collaborators,
Affiliations
- PMID: 23401401
- PMCID: PMC3602256
- DOI: 10.1503/cmaj.120592
Item in Clipboard
Review
Adjustment for continuous confounders: an example of how to prevent residual confounding
CMAJ.
.
No abstract available
Figures
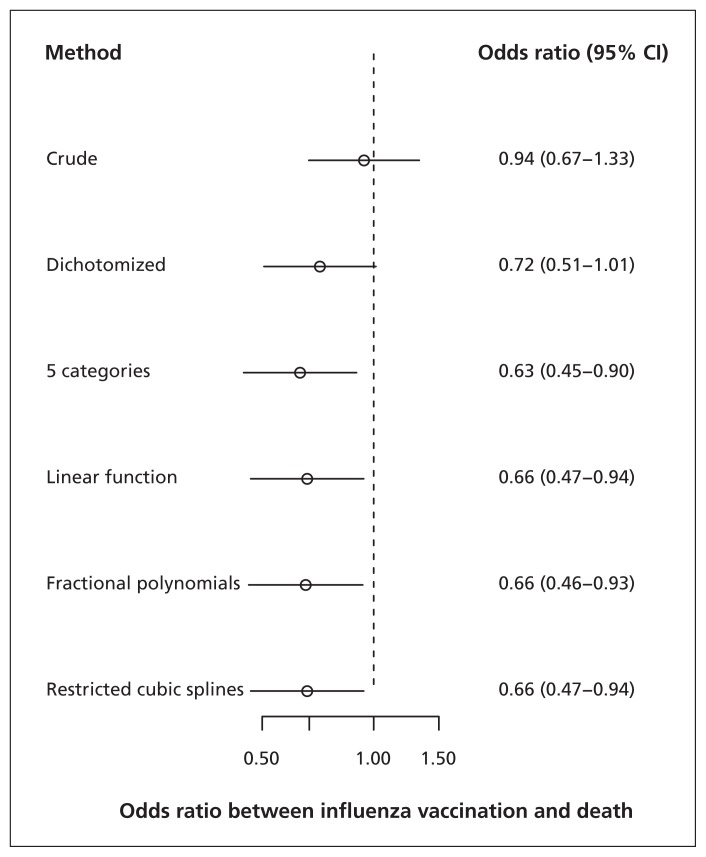
Comparison of methods to model the relation between a continuous confounder (use of health care) and outcome (death) in a study of influenza vaccination. Use of health care was defined as the number of contacts with general practitioners in the 12 months before the influenza vaccination. Use of health care was dichotomized at the median (i.e., 12 contacts in the 12 months before the vaccination). Use of health care was divided into 5 categories based on quintiles; cut-values were 5, 9, 14 and 22 contacts in the 12 months before the vaccination. CI = confidence interval.
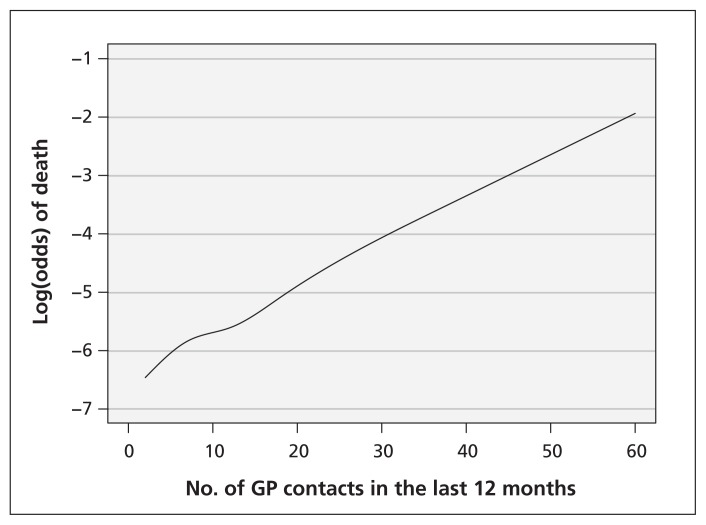
Functional relation between the continuous confounder use of health care and death in a study of influenza vaccination. GP = general practitioner.
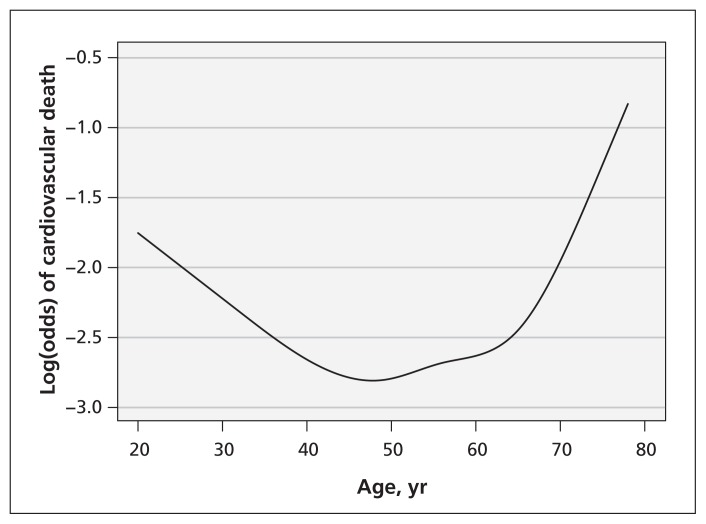
Functional relation between the continuous confounder age and cardiovascular death in a study of cardiovascular risk factors.
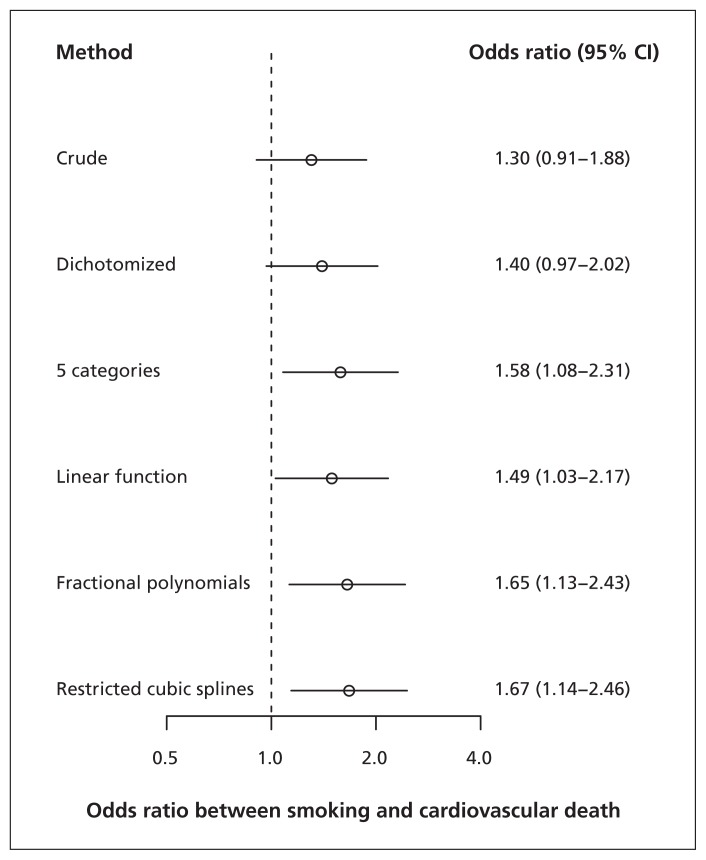
Comparison of methods to model the relation between a continuous confounder (age) and outcome (cardiovascular death) in a study of cardiovascular risk factors (notably smoking). Age was dichotomized at the median (i.e., 56 yr). Age was divided into 5 categories based on quintiles; cut-values were 45, 53, 60 and 68 years. CI = confidence interval.
References
-
- Royston P, Altman DG, Sauerbrei W. Dichotomizing continuous predictors in multiple regression: a bad idea. Stat Med 2006; 25:127–41 - PubMed
-
- Steyerberg EW. Clinical prediction models: a practical approach to development, validation and updating. New York: Springer; 2009
-
- Harrell FE., Jr Regression modelling strategies: with applications to linear models, logistic regression, and survival analysis. New York: Springer; 2001. p. 16–26
-
- Royston P, Moons KG, Altman DG, et al. Prognosis and prognostic research: developing a prognostic model. BMJ 2009;338:b604. - PubMed
-
- Groenwold RHH, van Deursen AM, Hoes AW, et al. Poor quality of reporting confounding bias in observational intervention studies: a systematic review. Ann Epidemiol 2008;18:746–51 - PubMed
Publication types
MeSH terms
Substances
LinkOut - more resources
Full Text Sources
Other Literature Sources
Medical