. 2013 Feb 26;110(9):3429-34.
doi: 10.1073/pnas.1214104110. Epub 2013 Feb 11.

Surface exposure to sunlight stimulates CO2 release from permafrost soil carbon in the Arctic

Affiliations

Surface exposure to sunlight stimulates CO2 release from permafrost soil carbon in the Arctic

Rose M Cory et al. Proc Natl Acad Sci U S A. .

Abstract

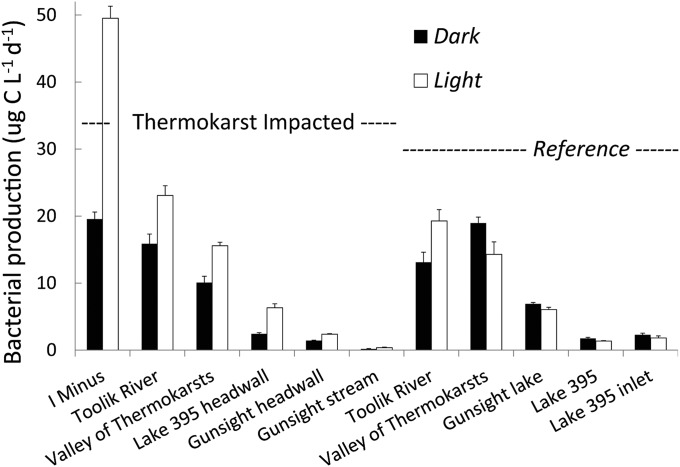
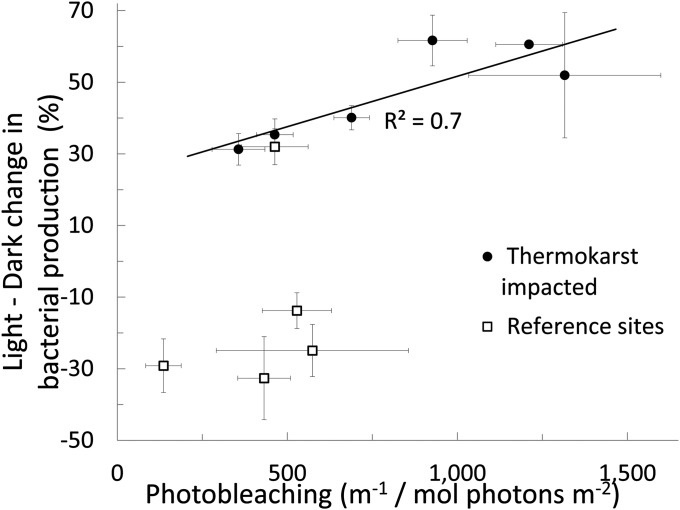
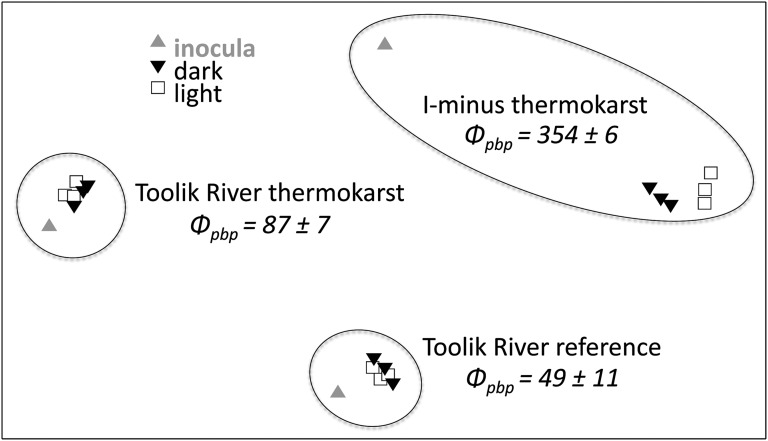
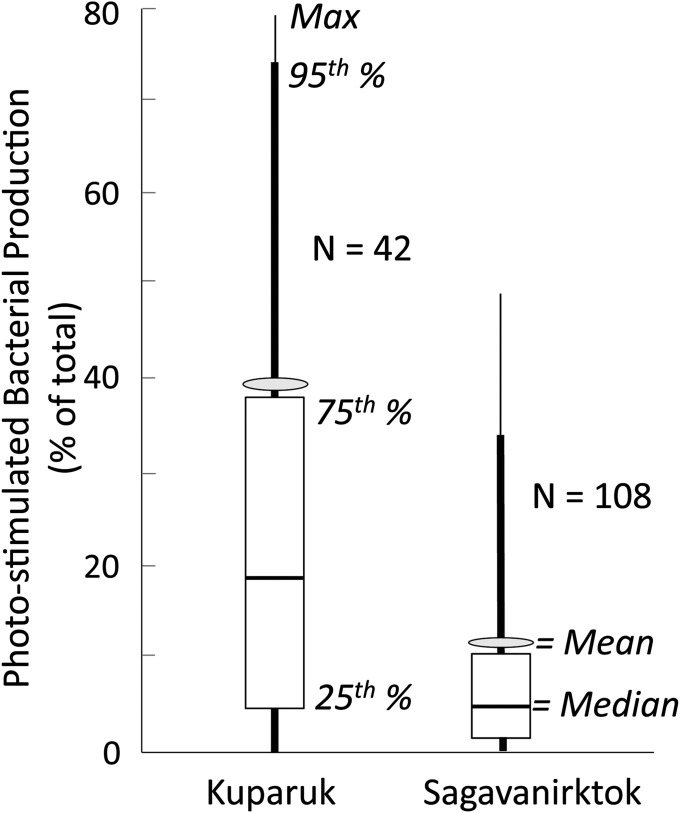
Recent climate change has increased arctic soil temperatures and thawed large areas of permafrost, allowing for microbial respiration of previously frozen C. Furthermore, soil destabilization from melting ice has caused an increase in thermokarst failures that expose buried C and release dissolved organic C (DOC) to surface waters. Once exposed, the fate of this C is unknown but will depend on its reactivity to sunlight and microbial attack, and the light available at the surface. In this study we manipulated water released from areas of thermokarst activity to show that newly exposed DOC is >40% more susceptible to microbial conversion to CO(2) when exposed to UV light than when kept dark. When integrated over the water column of receiving rivers, this susceptibility translates to the light-stimulated bacterial activity being on average from 11% to 40% of the total areal activity in turbid versus DOC-colored rivers, respectively. The range of DOC lability to microbes seems to depend on prior light exposure, implying that sunlight may act as an amplification factor in the conversion of frozen C stores to C gases in the atmosphere.


Conflict of interest statement

The authors declare no conflict of interest.

Figures

Fig. 1.
Fig. 1.
In thermokarst impacted sites (Left), water exposed to natural sunlight stimulated bacterial activity by 46.8% (white versus black bars), whereas in corresponding reference sites the mean response was to decrease bacterial activity by −13.7% (single-factor ANOVA, P = 0.0008, n = 11, SE of three replicate samples for each bar for each site are shown).
Fig. 2.
Fig. 2.
Percent difference between bacterial activity grown in light-exposed versus dark water plotted against the normalized moles of photons absorbed (photobleaching, integrated from 305 to 395 nm) in each thermokarst sample and its adjacent reference site. This illustrates that the extent of photobleaching controls the amplification of bacterial activity by light. SE bars are from three replicates for each sample or treatment; some error bars are hidden by the symbol. Ordinary least squares regression of percent change in bacterial activity versus photobleaching, R2 = 0.72, n = 6, P = 0.03.
Fig. 3.
Fig. 3.
Bacterial community composition for three sites showing the initial inoculum for regrowth experiments (gray triangle), the final dark treatment (black inverted triangle), and the final light treatment (open square) plotted using multidimensional scaling (MDS, 2D stress of analysis = 0.03). The sites had different bacterial community compositions (shown by distances between sites on the plot), and each community shifted in species composition between the original (inoculum) and the final light or dark treatments after 6 d [shifts from the inoculum effectively control for the “experiment bias” (26, 28)]. These shifts illustrate that the bacterial community composition is related to quantum yield of photoproduct-supported bacterial activity. The magnitude of shift between light and dark treatments was greatest for the I-Minus thermokarst site, which had the highest apparent quantum yield, Фpbp (µmol C/mol photon) of all samples and much greater photobleaching (1,211 ± 98) than Toolik River thermokarst (357 ± 78) or Toolik River reference (463 ± 76) SE [m−1/(mol photons m−2)], Table S2).
Fig. 4.
Fig. 4.
Estimates of light-stimulated bacterial production integrated over the entire water column (areal) as a percentage of total light plus dark bacterial production in the Kuparuk and Sagavanirktok Rivers (Materials and Methods). Distributions of mean, median, minimum, maximum, 5th, 25th, 75th, and 95th percentiles were generated by the natural variation in measured surface irradiance, extinction of irradiance with depth (Fig. S3), and apparent quantum yields (Φpbp, µmol C/mol photon) in thermokarst water at six study sites (Table S2); Kuparuk n = 42, Sagavanirktok n = 108 combinations.

References

    1. Zimov SA, Schuur EAG, Chapin FS., 3rd Climate change: Permafrost and the global carbon budget. Science. 2006;312(5780):1612–1613. - PubMed
    1. Ping CL, et al. High stocks of soil organic carbon in the North American Arctic region. Nat Geosci. 2008;1:615–619.
    1. Tarnocai C, et al. Soil organic carbon pools in the northern circumpolar permafrost region. Global Biogeochem Cycles. 2009;23 doi: 10.1029/2008GB003327. - DOI
    1. Osterkamp TE, Romanovsky VE. Evidence for warming and thawing of discontinuous permafrost in Alaska. Permafrost Periglacial Processes. 1999;10:17–37.
    1. Brown JG, Hinkel KM, Nelson FE. The Circumpolar Active Layer Monitoring (CALM) program: Research designs and initial results. Polar Geography. 2000;24:165–258.

Publication types

LinkOut - more resources