

Biofilm streamers cause catastrophic disruption of flow with consequences for environmental and medical systems
- PMID: 23401501
- PMCID: PMC3600445
- DOI: 10.1073/pnas.1300321110
Biofilm streamers cause catastrophic disruption of flow with consequences for environmental and medical systems
Abstract
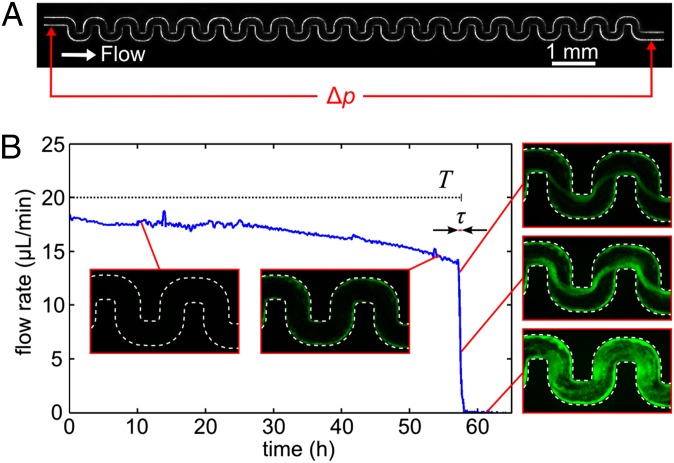
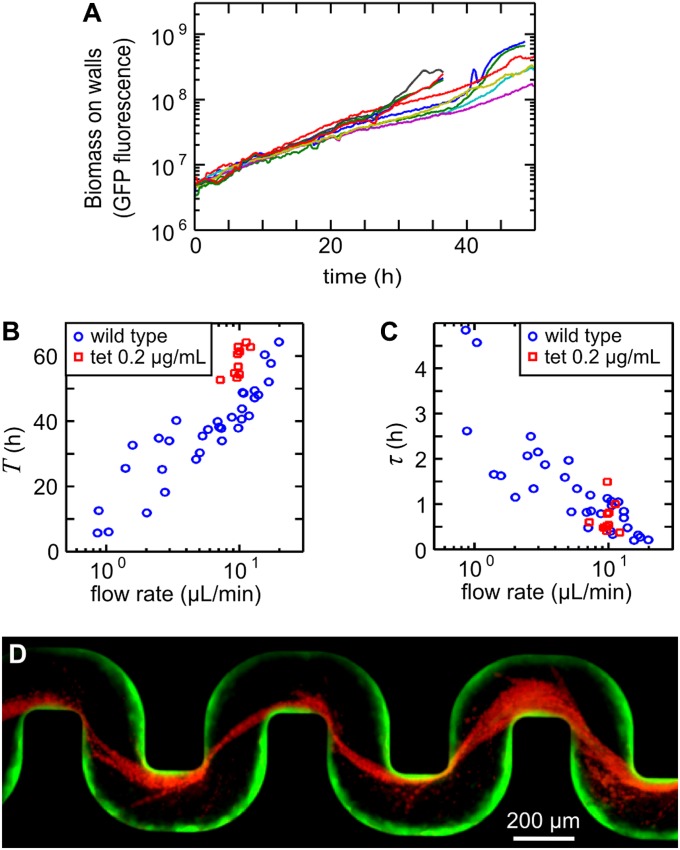
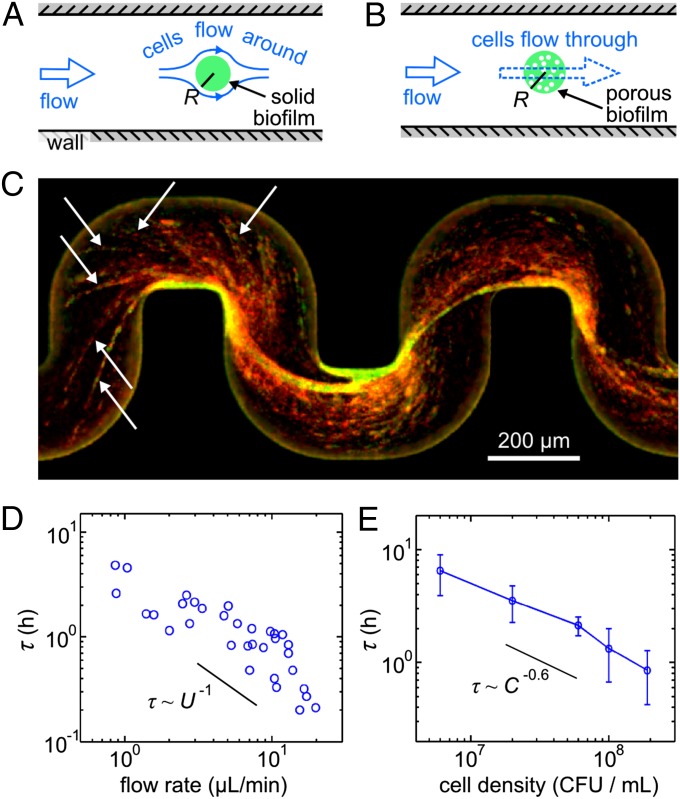
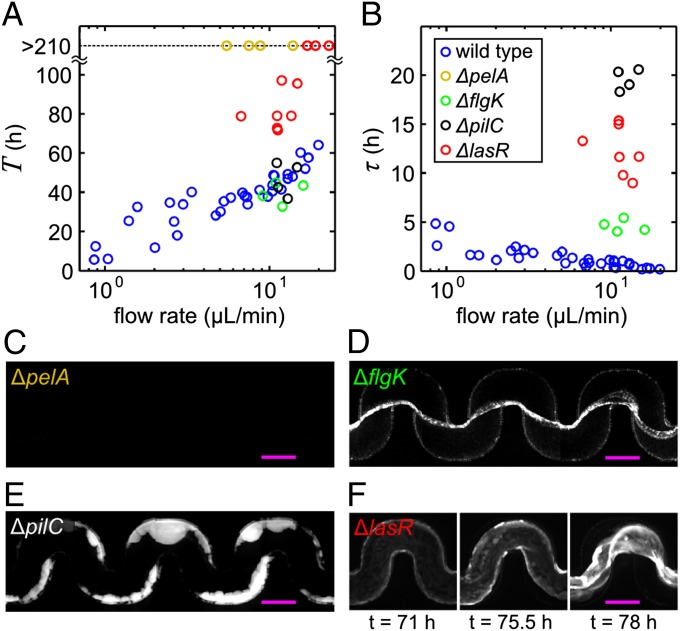
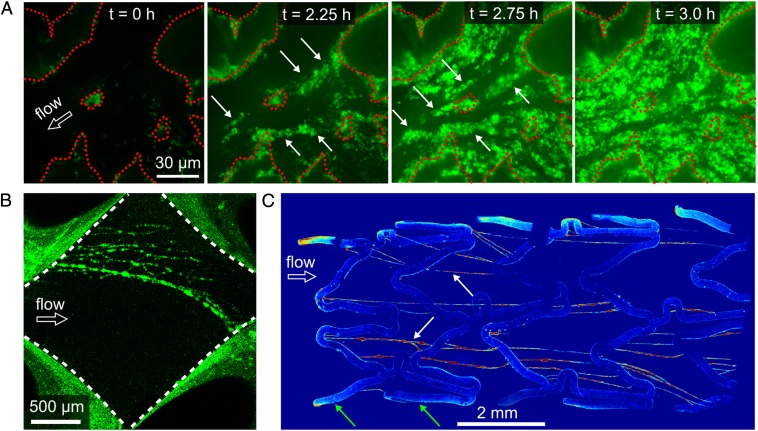
Biofilms are antibiotic-resistant, sessile bacterial communities that occupy most moist surfaces on Earth and cause chronic and medical device-associated infections. Despite their importance, basic information about biofilm dynamics in common ecological environments is lacking. Here, we demonstrate that flow through soil-like porous materials, industrial filters, and medical stents dramatically modifies the morphology of Pseudomonas aeruginosa biofilms to form 3D streamers, which, over time, bridge the spaces between obstacles and corners in nonuniform environments. We discovered that accumulation of surface-attached biofilm has little effect on flow through such environments, whereas biofilm streamers cause sudden and rapid clogging. We demonstrate that flow-induced shedding of extracellular matrix from surface-attached biofilms generates a sieve-like network that captures cells and other biomass, which add to the existing network, causing exponentially fast clogging independent of growth. These results suggest that biofilm streamers are ubiquitous in nature and strongly affect flow through porous materials in environmental, industrial, and medical systems.
Conflict of interest statement
The authors declare no conflict of interest.
Figures
Similar articles
-
The structural role of bacterial eDNA in the formation of biofilm streamers.Proc Natl Acad Sci U S A. 2022 Mar 22;119(12):e2113723119. doi: 10.1073/pnas.2113723119. Epub 2022 Mar 15. Proc Natl Acad Sci U S A. 2022. PMID: 35290120 Free PMC article.
-
Laminar flow around corners triggers the formation of biofilm streamers.J R Soc Interface. 2010 Sep 6;7(50):1293-9. doi: 10.1098/rsif.2010.0096. Epub 2010 Mar 31. J R Soc Interface. 2010. PMID: 20356880 Free PMC article.
-
Formation and post-formation dynamics of bacterial biofilm streamers as highly viscous liquid jets.Sci Rep. 2014 Nov 20;4:7126. doi: 10.1038/srep07126. Sci Rep. 2014. PMID: 25410423 Free PMC article.
-
Pseudomonas aeruginosa Biofilm, a Programmed Bacterial Life for Fitness.J Microbiol Biotechnol. 2017 Jun 28;27(6):1053-1064. doi: 10.4014/jmb.1611.11056. J Microbiol Biotechnol. 2017. PMID: 28301918 Review.
-
Pseudomonas aeruginosa biofilm infections: from molecular biofilm biology to new treatment possibilities.APMIS Suppl. 2014 Dec;(138):1-51. doi: 10.1111/apm.12335. APMIS Suppl. 2014. PMID: 25399808 Review.
Cited by
-
Fluid flow drives phenotypic heterogeneity in bacterial growth and adhesion on surfaces.Nat Commun. 2024 Jul 22;15(1):6161. doi: 10.1038/s41467-024-49997-1. Nat Commun. 2024. PMID: 39039040 Free PMC article.
-
Bacterial floc mediated rapid streamer formation in creeping flows.Sci Rep. 2015 Aug 17;5:13070. doi: 10.1038/srep13070. Sci Rep. 2015. PMID: 26278133 Free PMC article.
-
Cellular advective-diffusion drives the emergence of bacterial surface colonization patterns and heterogeneity.Nat Commun. 2019 Jun 6;10(1):2471. doi: 10.1038/s41467-019-10469-6. Nat Commun. 2019. PMID: 31171786 Free PMC article.
-
A quorum-sensing inhibitor blocks Pseudomonas aeruginosa virulence and biofilm formation.Proc Natl Acad Sci U S A. 2013 Oct 29;110(44):17981-6. doi: 10.1073/pnas.1316981110. Epub 2013 Oct 18. Proc Natl Acad Sci U S A. 2013. PMID: 24143808 Free PMC article.
-
Varied solutions to multicellularity: The biophysical and evolutionary consequences of diverse intercellular bonds.Biophys Rev (Melville). 2022 Jun;3(2):021305. doi: 10.1063/5.0080845. Epub 2022 Jun 1. Biophys Rev (Melville). 2022. PMID: 35673523 Free PMC article. Review.
References
-
- Hall-Stoodley L, et al. Towards diagnostic guidelines for biofilm-associated infections. FEMS Immunol Med Microbiol. 2012;65(2):127–145. - PubMed
-
- Kolter R, Greenberg EP. Microbial sciences: The superficial life of microbes. Nature. 2006;441(7091):300–302. - PubMed
-
- Branda SS, Vik S, Friedman L, Kolter R. Biofilms: The matrix revisited. Trends Microbiol. 2005;13(1):20–26. - PubMed
-
- Flemming H-C, Wingender J. The biofilm matrix. Nat Rev Microbiol. 2010;8(9):623–633. - PubMed
Publication types
MeSH terms
Substances
Grants and funding
LinkOut - more resources
Full Text Sources
Other Literature Sources
