

Quantitative analysis of the time course of Aβ oligomerization and subsequent growth steps using tetramethylrhodamine-labeled Aβ
- PMID: 23401512
- PMCID: PMC3587211
- DOI: 10.1073/pnas.1222478110
Quantitative analysis of the time course of Aβ oligomerization and subsequent growth steps using tetramethylrhodamine-labeled Aβ
Abstract
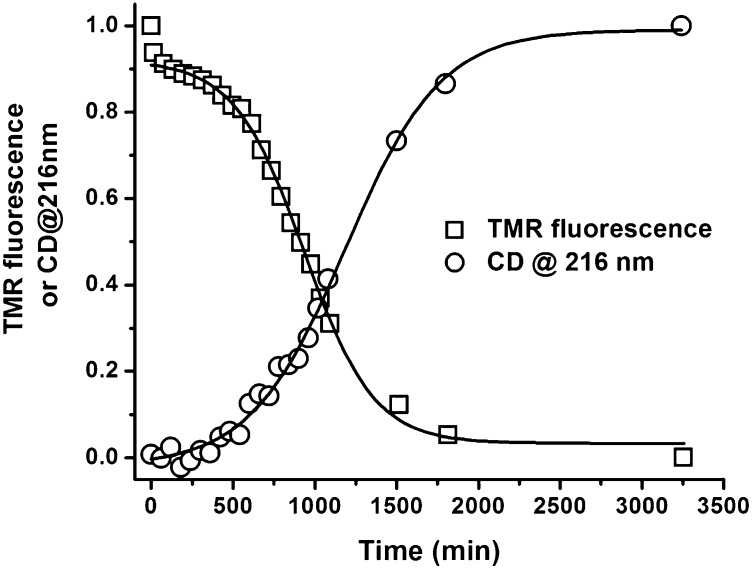
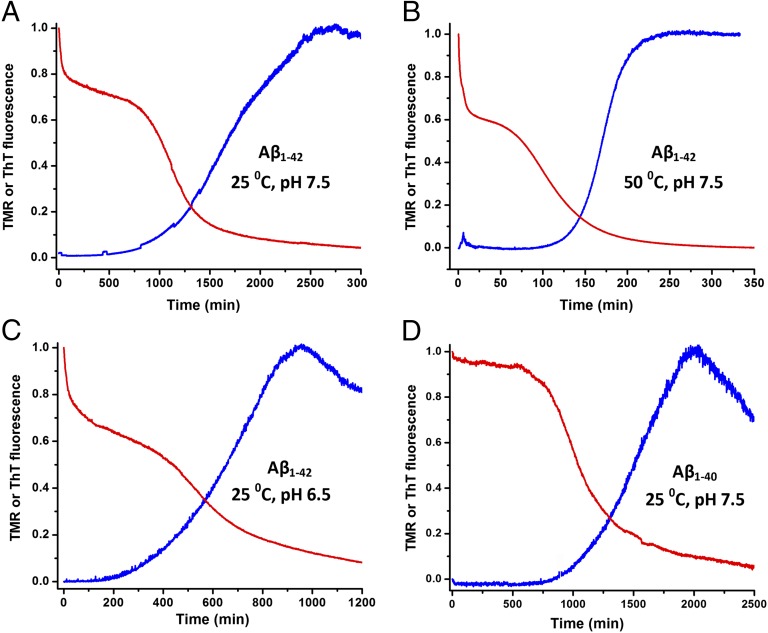
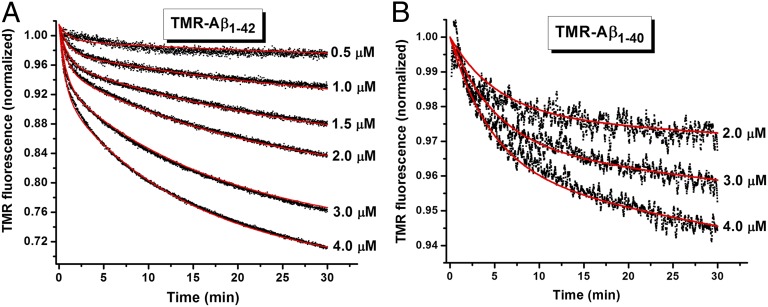
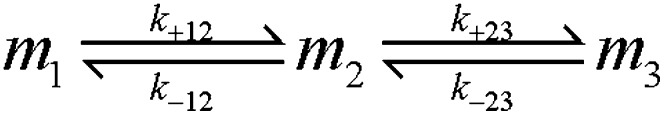
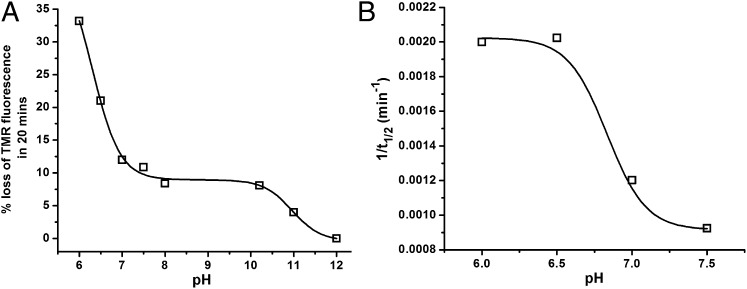
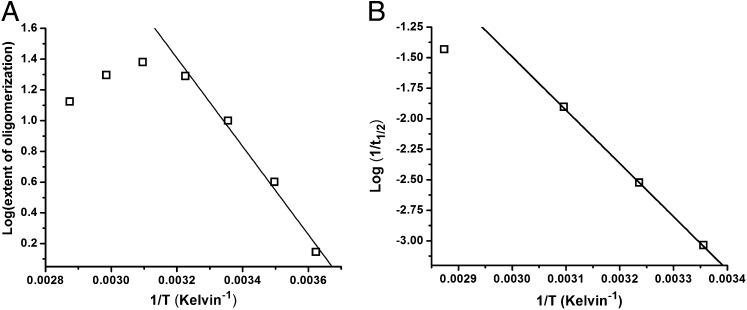
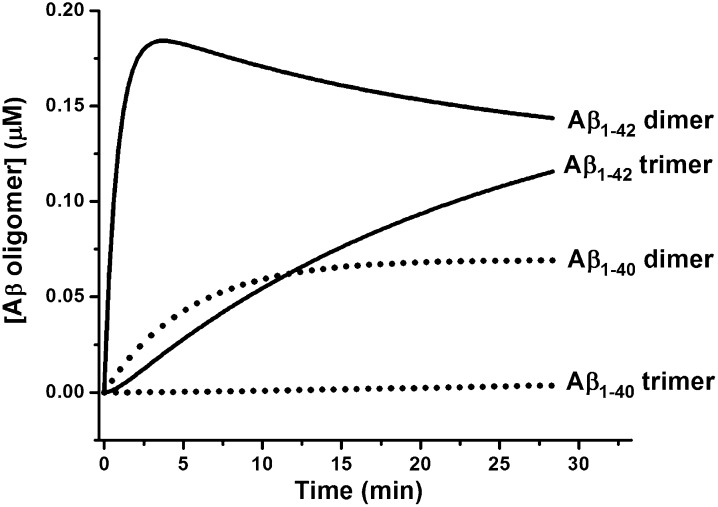
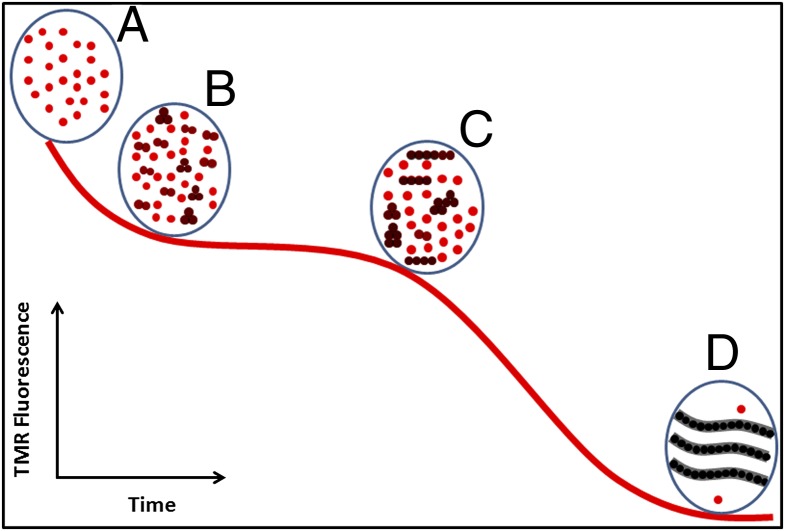
Although amyloid β (Aβ) is a critical player in the pathology of Alzheimer's disease, there is currently little Information on the rate and extent of formation of oligomers that lead to the presence of Aβ fibrils observed in amyloid plaques. Here we describe a unique method to monitor the full time course of Aβ aggregation. In this method, Aβ is labeled with tetramethylrhodamine at a lysine residue on the N-terminal end. During aggregation, the fluorescence is quenched in a time-dependent manner in three distinct phases: an early oligomerization phase, an intermediate phase, and a growth phase. The oligomerization phase can be characterized as a monomer-dimer-trimer process for which we have determined the rate and equilibrium constants. The rate constants differ markedly between Aβ(1-42) and Aβ(1-40), with Aβ(1-42) showing a greater oligomerization propensity. The intermediate phase reflects slow clustering and reorganization of the oligomers, whereas the growth phase ultimately results in the formation of fibrillar material. The data are consistent with a conformational change being an important rate-limiting step in the overall aggregation process. The rates of all phases are highly sensitive to temperature and pH, with the pH-dependent data indicating important roles for lysine and histidine residues. From the temperature-dependent data, activation energies of oligomerization and fibrillization are estimated to be 5.5 and 12.1 kCal/mol, respectively. The methodologies presented here are simple and can be applied to other amyloidogenic peptides or proteins.
Conflict of interest statement
The authors declare no conflict of interest.
Figures
Similar articles
-
Controlling {beta}-amyloid oligomerization by the use of naphthalene sulfonates: trapping low molecular weight oligomeric species.J Biol Chem. 2005 Oct 14;280(41):34747-54. doi: 10.1074/jbc.M501651200. Epub 2005 Jul 22. J Biol Chem. 2005. PMID: 16041062
-
The Japanese mutant Aβ (ΔE22-Aβ(1-39)) forms fibrils instantaneously, with low-thioflavin T fluorescence: seeding of wild-type Aβ(1-40) into atypical fibrils by ΔE22-Aβ(1-39).Biochemistry. 2011 Mar 29;50(12):2026-39. doi: 10.1021/bi1016217. Epub 2011 Feb 24. Biochemistry. 2011. PMID: 21291268 Free PMC article.
-
Molecular Mechanism and Kinetics of Amyloid-β42 Aggregate Formation: A Simulation Study.ACS Chem Neurosci. 2019 Nov 20;10(11):4643-4658. doi: 10.1021/acschemneuro.9b00473. Epub 2019 Nov 11. ACS Chem Neurosci. 2019. PMID: 31660732 Free PMC article.
-
Elucidating the Structures of Amyloid Oligomers with Macrocyclic β-Hairpin Peptides: Insights into Alzheimer's Disease and Other Amyloid Diseases.Acc Chem Res. 2018 Mar 20;51(3):706-718. doi: 10.1021/acs.accounts.7b00554. Epub 2018 Mar 6. Acc Chem Res. 2018. PMID: 29508987 Free PMC article. Review.
-
Alzheimer's disease.Subcell Biochem. 2012;65:329-52. doi: 10.1007/978-94-007-5416-4_14. Subcell Biochem. 2012. PMID: 23225010 Review.
Cited by
-
A computational model of Alzheimer's disease at the nano, micro, and macroscales.Front Neuroinform. 2024 Mar 22;18:1348113. doi: 10.3389/fninf.2024.1348113. eCollection 2024. Front Neuroinform. 2024. PMID: 38586183 Free PMC article.
-
Numerical Simulations Reveal Randomness of Cu(II) Induced Aβ Peptide Dimerization under Conditions Present in Glutamatergic Synapses.PLoS One. 2017 Jan 26;12(1):e0170749. doi: 10.1371/journal.pone.0170749. eCollection 2017. PLoS One. 2017. PMID: 28125716 Free PMC article.
-
Amyloid-β oligomerization monitored by single-molecule stepwise photobleaching.Methods. 2021 Sep;193:80-95. doi: 10.1016/j.ymeth.2020.06.007. Epub 2020 Jun 13. Methods. 2021. PMID: 32544592 Free PMC article.
-
Expression of N-Terminal Cysteine Aβ42 and Conjugation to Generate Fluorescent and Biotinylated Aβ42.Biochemistry. 2021 Apr 20;60(15):1191-1200. doi: 10.1021/acs.biochem.1c00105. Epub 2021 Apr 1. Biochemistry. 2021. PMID: 33793198 Free PMC article.
-
Amyloid β oligomers in Alzheimer's disease pathogenesis, treatment, and diagnosis.Acta Neuropathol. 2015 Feb;129(2):183-206. doi: 10.1007/s00401-015-1386-3. Epub 2015 Jan 22. Acta Neuropathol. 2015. PMID: 25604547 Free PMC article. Review.
References
-
- Morris AM, Watzky MA, Finke RG. Protein aggregation kinetics, mechanism, and curve-fitting: A review of the literature. Biochim Biophys Acta. 2009;1794(3):375–397. - PubMed
-
- Lashuel HA, Hartley D, Petre BM, Walz T, Lansbury PT., Jr Neurodegenerative disease: Amyloid pores from pathogenic mutations. Nature. 2002;418(6895):291. - PubMed
-
- Klein WL, Stine WB, Jr, Teplow DB. Small assemblies of unmodified amyloid beta-protein are the proximate neurotoxin in Alzheimer’s disease. Neurobiol Aging. 2004;25(5):569–580. - PubMed
Publication types
MeSH terms
Substances
LinkOut - more resources
Full Text Sources
Other Literature Sources
