. 2013 Mar 15;190(6):2603-13.
doi: 10.4049/jimmunol.1200852. Epub 2013 Feb 11.

Retinoic acid hypersensitivity promotes peripheral tolerance in recent thymic emigrants

Affiliations

Retinoic acid hypersensitivity promotes peripheral tolerance in recent thymic emigrants

Suniti Bhaumik et al. J Immunol. .

Abstract

Whereas thymic education eliminates most self-reactive T cells, additional mechanisms to promote tolerance in the periphery are critical to prevent excessive immune responses against benign environmental Ags and some self-Ags. In this study we show that murine CD4(+) recent thymic emigrants (RTEs) are programmed to facilitate tolerance in the periphery. Both in vitro and in vivo, naive RTEs more readily upregulate Foxp3 than do mature naive cells after stimulation under tolerogenic conditions. In RTEs, a relatively high sensitivity to retinoic acid contributes to decreased IFN-γ production, permitting the expression of Foxp3. Conversely, mature naive CD4 cells have a lower sensitivity to retinoic acid, resulting in increased IFN-γ production and subsequent IFN-γ-mediated silencing of Foxp3 expression. Enhanced retinoic acid signaling and Foxp3 induction in RTEs upon Ag encounter in the periphery may serve as form of secondary education that complements thymic education and helps avoid inappropriate immune responses. This mechanism for tolerance may be particularly important in settings where RTEs comprise a large fraction of the peripheral T cell pool, such as in newborns or after umbilical cord blood transplant.


Figures

Figure 1
Figure 1. Peripheral acquisition of Foxp3 expression in recent thymic emigrants (RTE) after adoptive transfer
(A) Starting percentages of Foxp3+ cells in sorted RTE and mature naïve CD4+ cells prior to transfer. Polyclonal populations of naïve CD4+ CD25 CD45RBhi cells from NG-BAC Thy1.1 mice were sorted into GFP+ RTEs and GFP mature naïve CD4+ T cell populations. In each of five separate sorts, Foxp3+ cells were rarer in sorted CD25 RTEs than in CD25 mature naive cells prior to transfer (0.6% vs. 1.4%, p<0.05). (B) Percentages of Foxp3+ cells in the transferred RTE and mature cells recovered from each tissue. After sorting, 2×10⁶ RTE or mature naive Thy1.1+ CD4+ cells were adoptively transferred into BALB/c hosts (n = 5 per group). Two weeks later, CD4+ cells from spleens, mesenteric lymph nodes (MLN), and the intestinal lamina propria lymphocytes (LPL) were isolated and stained for Foxp3 and Thy1.1 to identify the transferred RTE or mature (Mat) cells. Bars indicate mean Foxp3 percentages with p-values (student t test) as indicated. The results are representative of five similar experiments.
Figure 2
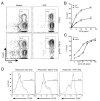
Figure 2. Increased Foxp3 induction in RTEs in vitro
(A) Flow cytometric analysis of Foxp3 expression in cultured RTE and mature naïve cells. GFP mature naive and GFP+ RTE cells were sorted from NG-BAC Rag2−/− DO11.10+ mice and stimulated in vitro with anti-CD3/anti-CD28 microbeads and 5 ng/ml TGF-β with or without 0.1 nM at-RA added as indicated then analyzed on day 5 for Foxp3 expression. The percentages of Foxp3+ cells are indicated. (B) Graph of the percentage of Foxp3+ cells in mature naïve CD4+ T cells (closed circles) and RTEs (closed triangles) across a range of TGF-β concentrations with no at-RA added above the basal levels present from serum in the media. Plotted are the means +/− SD of triplicate samples for each condition. Similar data were obtained in 3 separate experiments. (C) Graph of the percentage of Foxp3+ cells in mature naïve CD4+ T cells (closed circles) and RTEs (closed triangles) across a range of at-RA concentrations with 5 ng/ml TGF-β. Plotted are the means +/− SD of triplicate samples for each condition. Similar data were obtained in 5 separate experiments. (D) RTE-derived iTregs are suppressive in vitro. CFSE-labeled responder cells were co-cultured with APCs, anti-CD3 (5μg/ml), and either RTE-or mature T cell-derived iTregs at a ratio of 1:2. Proliferation of the responder cells was assessed by flow cytometry on day 3. Data are representative of 3 separate experiments.
Figure 3
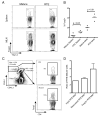
Figure 3. Increased Foxp3 expression in RTEs compared to mature naïve CD4+ T cells in antigen-specific oral tolerance
In (A) and (B), Thy1.2+ CD4+ cells from NG-BAC Rag−/− DO mice were sorted into GFP mature naive and GFP+ RTE fractions, and 1×10⁶ cells were transferred to groups (n=4) of Thy1.1 congenic BALB/c recipients. After 5 days on a diet that included 1% ovalbumin in the drinking water, spleens and mesenteric lymph nodes (MLN) were collected, and the Thy1.2+ transferred cells were analyzed by flow cytometry for Foxp3 expression. In (C) and (D), GFP+ RTEs from CD45.1+/− OT-II mice were mixed at a ratio of 3:1 with GFP mature cells from CD45.1+/+ OT-II mice and 1×10⁶ total cells were transferred to CD45.2+/+ WT recipients. The recipients were placed on an OVA diet as above and MLN cells were analyzed by flow cytometry on day 5. (A) Representative FACS plots of Foxp3 expression in recovered Thy1.2+ cells from spleens and mesenteric lymph nodes as indicated. (B) Summarized oral tolerance results from one experiment. Bars indicate the mean for each group with p-values (student t-test) as indicated. Similar results were obtained in 3 separate experiments. (C) Representative FACS plots showing recovery of allelically marked RTE and mature antigen-specific cells after co-transfer. (D) Summary plot showing the ratios of allelically marked RTE and mature cells in transferred and recovered cells. RTEs showed equivalent survival to mature cells and a trend toward increased conversion to a Foxp3+ phenotype with the ratio of total RTE:mature cells recovered matching the 3:1 input ratio and the ratio of recovered Foxp3+RTE:Foxp3+ mature cells equaling 6:1 (p=0.1, n=4 animals). Shown are the mean ratios +/− SD.
Figure 4
Figure 4. Mature naïve CD4+ T cells reduce Foxp3 induction in RTEs in mixed cultures
CD4+ CD62L+ CD25 RTE and mature naive cells from NG-BAC Thy1.1+ and NG-BAC Thy1.2+ animals were sorted. Thy1.2+ RTEs or Thy1.2+ mature naïve cells were stimulated with antiCD3/anti-CD28 microbeads and 5 ng/ml TGF-β. Cells were stimulated either alone or mixed with the indicated ratios of Thy1.1+ mature:Thy1.2+ RTE cells (top panels) or Thy1.1+ RTE:Thy1.2+ mature cells (bottom panels). On day 5, the percentages of Foxp3+ Thy1.2+ cells were assessed by flow cytometry. The percentages of Foxp3+ cells +/− SD for one experiment are shown. Data are representative of 4 separate experiments.
Figure 5
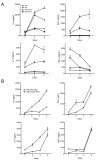
Figure 5. Cytokine production by stimulated RTEs and mature naive cells
(A) Sorted CD4+ L-selectin+ GFP+ RTEs and GFP mature naïve T cells were stimulated in vitro with anti-CD3/anti-CD28 microbeads in media alone or with 5 ng/ml TGF-β added. Supernatants were collected at the indicated times, and cytokines were measured by multiplex bead array. △, represents RTE CD4+ stimulated in media; ▲, represents RTE CD4+ stimulated in media + TGF-β; ○, represents mature naïve CD4+ T cells stimulated in media; and •, represents mature naïve cells stimulated in media with TGF-β (B) Sorted RTE (△) and mature naïve cells (○) were stimulated with irradiated APCs and OVA323-339 peptide. The data represent the mean of triplicate samples +/− SEM. Similar results were obtained in three separate experiments.
Figure 6
Figure 6. Role of IFN-γ in differential Foxp3 induction in RTEs and mature naive cells
(A) Exogenous IFN-γ suppresses Foxp3 induction in RTEs. GFP+ RTEs were sorted from NG-BAC Rag2−/− DO11.10+ mice and stimulated with anti-CD3/anti-CD28 microbeads and TGF-β (5 ng/ml) alone or with rIFN-γ (10 U/ml) added. Foxp3 expression was assessed on day 5 by flow cytometry. The percentages of Foxp3+ cells +/− SD are indicated. Data are representative of 3 separate experiments. (B) IFN-γ neutralization restores Foxp3 expression in mature naive cells in vitro. Sorted GFP+ RTE or GFP mature naïve CD4 T cells from NG-BAC Rag−/−DO+ mice were stimulated as in (A) with or without the addition of anti-IFN-γ (10 μg/ml) as indicated. The percentage of Foxp3+ cells +/− SD is indicated. Similar results were obtained in 3 separate experiments. (C) IFN-γ deficiency restores Foxp3 expression in mature naive CD4+ T cells during oral tolerance induction in vivo. Naïve mature and RTE CD4+ T cells were sorted from IFN-γ−/− or IFN-γ+/+ NG-BAC OT-II CD45.1+ mice and transferred to groups of C57BL/6 CD45.2 congenic mice (n=5) which received 1% ovalbumin in their drinking water for 5 days. Mesenteric lymph nodes (MLN) were collected, and the transferred CD45.1+ cells were analyzed for Foxp3 expression. Shown is the mean percent +/− SEM of FoxP3 expression in transferred cells. Similar results were also obtained in separate experiments in which IFN-γ was neutralized by antibody injection.
Figure 7
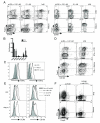
Figure 7. RTEs display increased sensitivity to at-RA
(A) Increased at-RA-dependent CD103 and CCR9 induction in RTEs. Sorted GFP+ RTEs and GFP mature naïve CD4+ T cells from NG-BAC Rag−/− DO+ mice were stimulated with anti-CD3/anti-CD28 microbeads, 5 ng/ml TGF-β, and at-RA as indicated. On day 5 of culture, the cells were collected and stained for Foxp3 and CD103 (left panels) or CCR9 (right panels). Data are representative of 3 separate experiments. (B) Real time PCR analysis of retinoic acid receptor expression in RTEs. Total RNA was collected from GFP+ RTE and GFP mature naïve CD4+ T cells that had been stimulated with anti-CD3/anti-CD28 microbeads for 48 hours in the presence of TGF-β. Shown are the mean fold differences +/− SD in expression of each gene relative to expression of RXRα in mature cells (after first normalizing samples by 18S gene expression) from 3 separate experiments. (C) Intracellular staining for retinoic acid receptors. Sorted RTE and mature cells were stimulated for 48 hours with TGF-β (5 ng/ml) and retinoic acid (0.1 nM), stained for intracellular RARα (left) or RARβ (right), and analyzed by flow cytometry. RTE cells prior to stimulation are shown as controls. Similar results were obtained in two separate experiments. (D and E) Increased responsiveness of RTEs to retinoic acid is independent of IFN-γ. RTE and mature cells were sorted from NGBAC IFN-γ−/− mice and stimulated as in (A). Shown in (D) are representative FACS plots of at-RA-mediated CD103 induction. Shown in (E) are histogram plots of CD103 and CCR9 induction across a range of at-RA concentrations. Mature cells stimulated without at-RA addition are included on each plot for comparison (gray histograms). Similar results were obtained in 2 separate experiments. (F) Inhibition of retinoic acid signaling restores IFN-γ secretion and inhibits Foxp3 expression in RTEs. Sorted GFP+ RTEs and GFP mature naive cells were stimulated with anti-CD3/anti-CD28 microbeads in the presence of 5 ng/ml TGF-β and the retinoic acid antagonist LE540 (1μM) with or without anti-IFN-γ (10μg/ml) as indicated. On day 5 of culture, the cells were stained for intracellular IFN-γ and Foxp3. Similar results were obtained in 3 separate experiments.

References

    1. Kyewski B, Klein L. A central role for central tolerance. Annu Rev Immunol. 2006;24:571–606. - PubMed
    1. Mueller DL. Mechanisms maintaining peripheral tolerance. Nat Immunol. 2010;11:21–27. - PubMed
    1. Wing K, Sakaguchi S. Regulatory T cells exert checks and balances on self tolerance and autoimmunity. Nat Immunol. 2010;11:7–13. - PubMed
    1. Danke NA, Koelle DM, Yee C, Beheray S, Kwok WW. Autoreactive T cells in healthy individuals. J Immunol. 2004;172:5967–5972. - PubMed
    1. Danke NA, Yang J, Greenbaum C, Kwok WW. Comparative study of GAD65-specific CD4+ T cells in healthy and type 1 diabetic subjects. J Autoimmun. 2005;25:303–311. - PubMed

Publication types

MeSH terms