Review
. 2013 Apr 15;591(8):2055-66.
doi: 10.1113/jphysiol.2012.248864. Epub 2013 Feb 11.

Bridging the genotype-phenotype gap: what does it take?

Affiliations
Review

Bridging the genotype-phenotype gap: what does it take?

Arne B Gjuvsland et al. J Physiol. .

Abstract

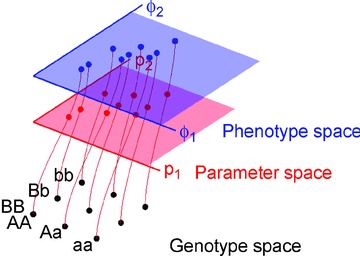
The genotype-phenotype map (GP map) concept applies to any time point in the ontogeny of a living system. It is the outcome of very complex dynamics that include environmental effects, and bridging the genotype-phenotype gap is synonymous with understanding these dynamics. The context for this understanding is physiology, and the disciplinary goals of physiology do indeed demand the physiological community to seek this understanding. We claim that this task is beyond reach without use of mathematical models that bind together genetic and phenotypic data in a causally cohesive way. We provide illustrations of such causally cohesive genotype-phenotype models where the phenotypes span from gene expression profiles to development of whole organs. Bridging the genotype-phenotype gap also demands that large-scale biological ('omics') data and associated bioinformatics resources be more effectively integrated with computational physiology than is currently the case. A third major element is the need for developing a phenomics technology way beyond current state of the art, and we advocate the establishment of a Human Phenome Programme solidly grounded on biophysically based mathematical descriptions of human physiology.


Figures

Figure 1
Figure 1. Decomposition of the genotype-phenotype map
In causally cohesive genotype–phenotype (cGP) models, the mapping from genotypes to phenotypes can be decomposed into two separate mappings. Mathematical models describing the dynamics of a biological system typically contain two types of elements, state variables that change with time and parameters that remain constant over the time scale of the study. This scheme applies to any level of biological resolution. A phenotype is any observable characteristic of interest, such as the trajectory of a state variable or a summary thereof. Because the parameters in a physiological model can be conceived as aggregated summaries of finer-scale underlying models, parameters are phenotypes too. In a causally cohesive multiscale model, this leads to layers of models. The mapping from genotypes to parameters can in principle be experimentally measured. With current technology this is in most cases a daunting task, but considerable insight can be obtained even if one does not have detailed information about this mapping.
Figure 2
Figure 2. Bridging the genotype–phenotype gap with data and models at multiple phenotypic levels
A, three-dimensional structure of KCNQ1 potassium channel, looking in from outside the cell. The channel consists of four subunits with six segments (colour-coded). Pore regions (S5–S6) of one subunit interact with the adjacent subunit voltage-sensing region (S1–S4). B, alternative metastable conformations of the subunits, only one of which permits ions to pass. C, energy landscape of conformations as characterized by translation and rotation of the S4 segment, shown here for transmembrane voltage Vm= 0 mV. Labels P, IC, DC refer to conformations in B. D, Markov model that simplifies the state space of the ion channel into discrete states. Only when all 4 subunits are in the permissive state (P) on the energy landscape, can the channel open (transition to O1) to generate current. E, recorded traces from single ion channels, showing stochastic switching between open and closed states. F, macroscopic current; the sum of 1000 single channels. Both individual traces and macroscopic current can be directly simulated from the Markov model. G, effects of mutation on macroscopic current, as observed and as simulated via protein conformation stability and the Markov model. Modified from Silva et al. (2009), with permission.
Figure 3
Figure 3. Virtual genome-wide association analysis, looking for DNA variation to predict phenotypic variation
Targeting model parameters as intermediate phenotypes (C) proved more efficient than targeting top-level phenotypes alone (B). Panel A shows how a heart cell model, a genetic map and a virtual population are tied together by selecting heart model parameters assumed to be under the influence of genetic variation and associating the parameter variation to DNA variation (single nucleotide polymorphisms, SNPs) on virtual genomes. Individual genotypes are mapped into heart model parameters (steps 1–3), and by running the heart cell model parameters are mapped into cell-level phenotypes (step 4). Finally, GWAS analysis is then performed on the virtual population (step 5). (Fig. 1 of Wang et al. 2012). Panel B shows the variance in cellular phenotypes that could be explained using causal SNPs detected in GWAS targeting these phenotypes directly. Panel C shows improved results when using causal SNPs obtained from GWAS targeting all genetically controlled parameters. Each boxplot summarizes total explained variance by GWAS for 100 Monte Carlo runs. (Modified from Wang et al. 2012).
Figure 4
Figure 4. Linking genotype to phenotype through gene networks and tissue mechanics
A, cell behaviour is characterized by a combination of parameters for gene network properties and cellular properties. B, tissue morphology emerges from a model where the mesenchyme is a three-dimensional space in which molecules and mechanical stresses diffuse (mesh connects cell centres; colour indicates the diffusing inhibitor). C, the developing tooth shape at regular time intervals, starting from seven cells representing the tip of the oral epithelium invagination, where AD in the last panel identify seal tooth cusps. From Salazar-Ciudad & Jernvall (2010) with permission.

Similar articles

Cited by

References

    1. Alberch P. From genes to phenotype: dynamical systems and evolvability. Genetica. 1991;84:5–11. - PubMed
    1. Allen HL, et al. Hundreds of variants clustered in genomic loci and biological pathways affect human height. Nature. 2010;467:832–838. - PMC - PubMed
    1. Alon U. An Introduction to Systems Biology: Design Principles of Biological Circuits. Boca Raton, FL, USA: Chapman and Hall/CRC; 2006.
    1. Altinok A, Lévi F, Goldbeter A. A cell cycle automaton model for probing circadian patterns of anticancer drug delivery. Adv Drug Deliv Rev. 2007;59:1036–1053. - PubMed
    1. Aster RC, Borchers B, Thurber CH. Parameter Estimation and Inverse Problems, Second Edition. 2nd edn. New York: Academic Press; 2012.

Publication types