Review
. 2012:2012:961257.
doi: 10.1155/2012/961257. Epub 2012 Dec 6.

Multivoxel pattern analysis for FMRI data: a review

Affiliations
Review

Multivoxel pattern analysis for FMRI data: a review

Abdelhak Mahmoudi et al. Comput Math Methods Med. 2012.

Abstract

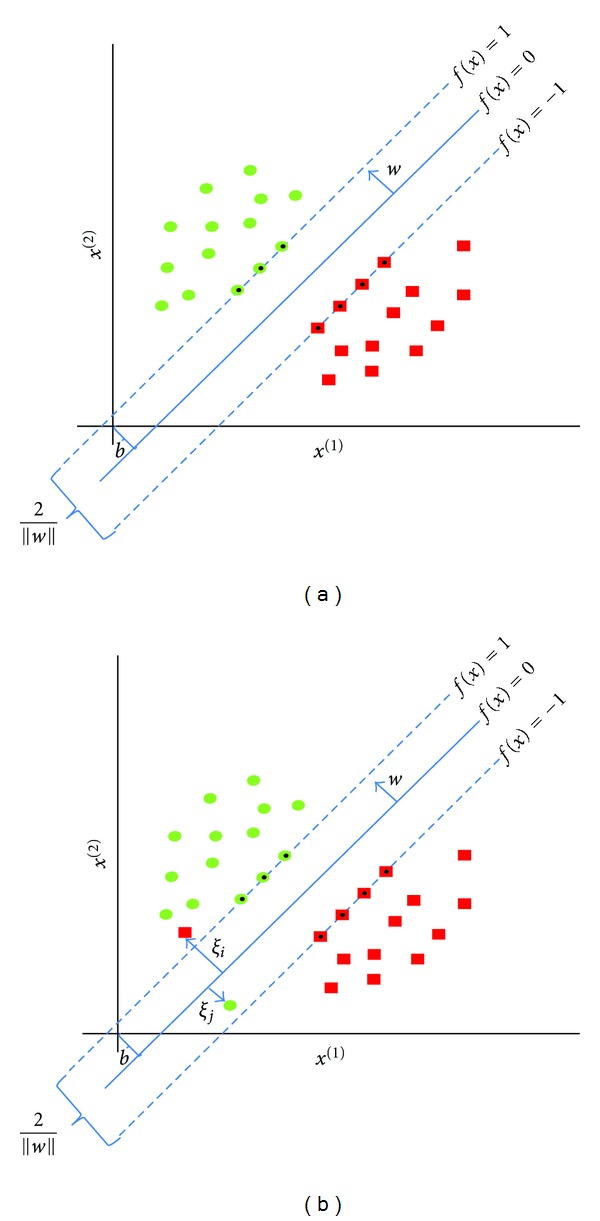
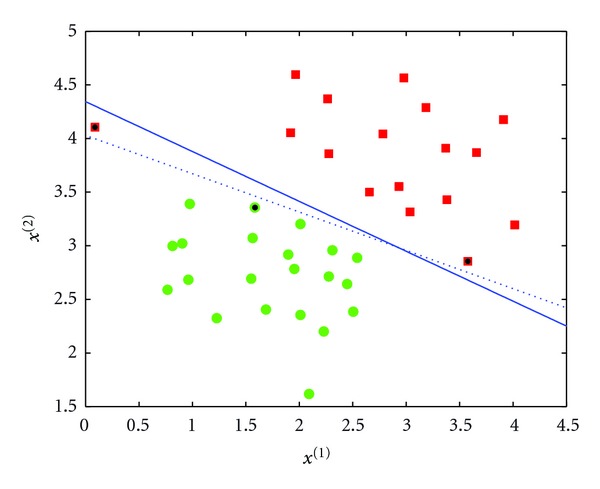
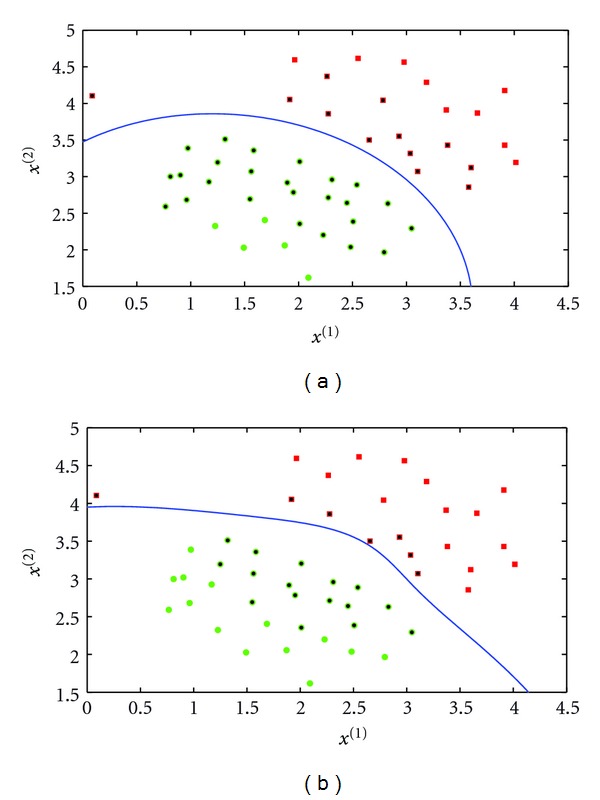
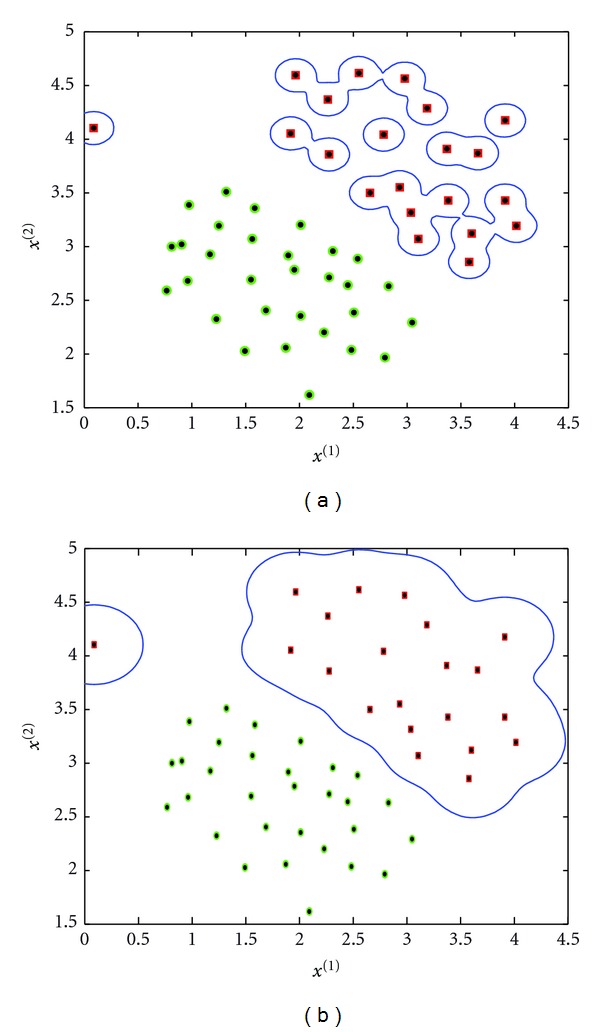
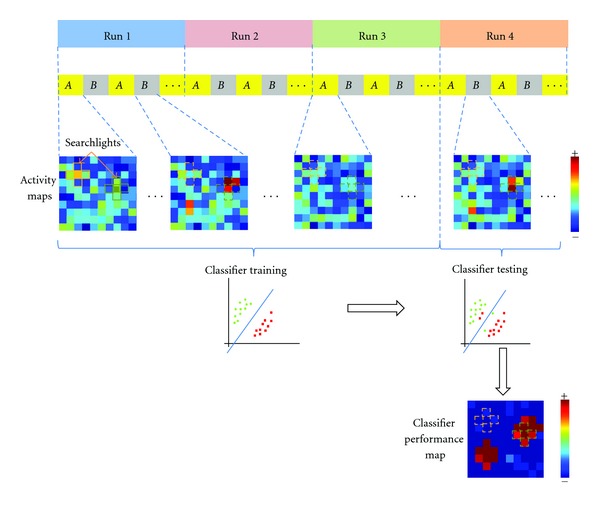
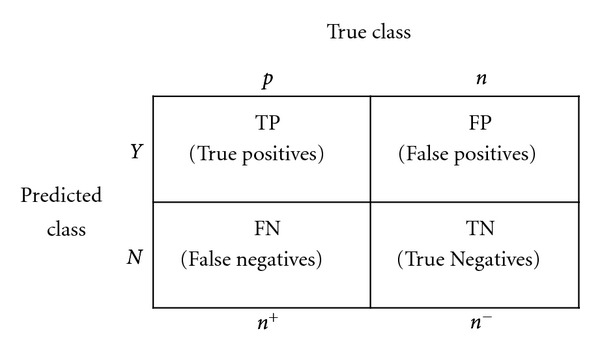
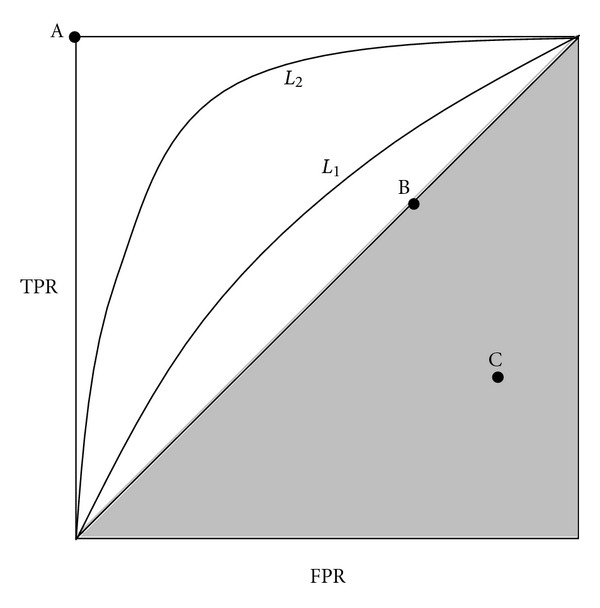
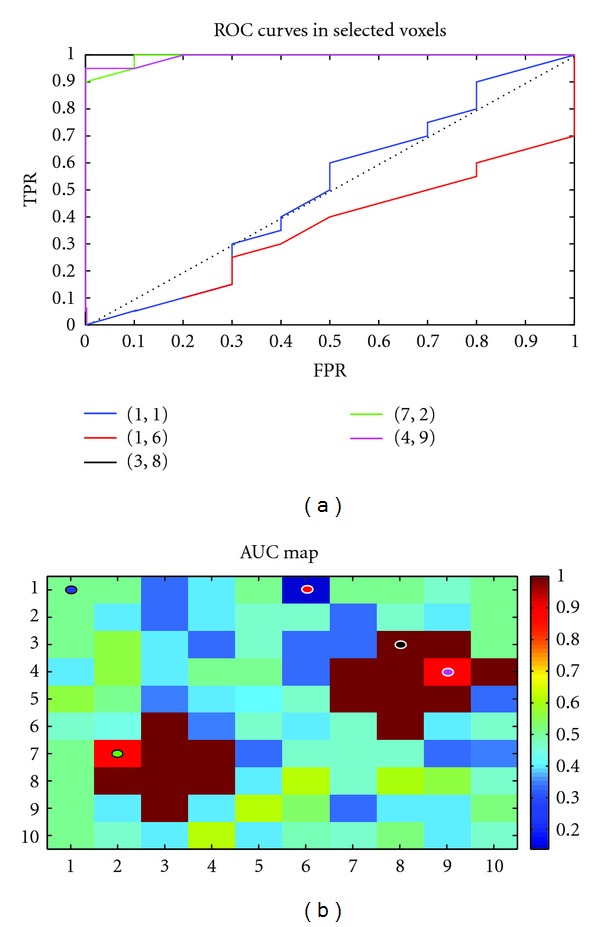
Functional magnetic resonance imaging (fMRI) exploits blood-oxygen-level-dependent (BOLD) contrasts to map neural activity associated with a variety of brain functions including sensory processing, motor control, and cognitive and emotional functions. The general linear model (GLM) approach is used to reveal task-related brain areas by searching for linear correlations between the fMRI time course and a reference model. One of the limitations of the GLM approach is the assumption that the covariance across neighbouring voxels is not informative about the cognitive function under examination. Multivoxel pattern analysis (MVPA) represents a promising technique that is currently exploited to investigate the information contained in distributed patterns of neural activity to infer the functional role of brain areas and networks. MVPA is considered as a supervised classification problem where a classifier attempts to capture the relationships between spatial pattern of fMRI activity and experimental conditions. In this paper , we review MVPA and describe the mathematical basis of the classification algorithms used for decoding fMRI signals, such as support vector machines (SVMs). In addition, we describe the workflow of processing steps required for MVPA such as feature selection, dimensionality reduction, cross-validation, and classifier performance estimation based on receiver operating characteristic (ROC) curves.


Figures

Figure 1
Figure 1
Thresholded statistical map overlaid on anatomical image.
Figure 2
Figure 2
2D space illustration of the decision boundary of the support vector machine (SVM) linear classifier. (a) the hard margin on linearly separable examples where no training errors are permitted. (b) the soft margin where two training errors are introduced to make data nonlinearly separable. Dotted examples are called the support vectors (they determine the margin by which the two classes are separated).
Figure 3
Figure 3
Effect of C on the decision boundary. The solid line (C = 0.1) allows some training errors (red example on the top left is misclassified). The dashed line (C = 10000) does not allow any training error. Even though the C = 0.1 case has one misclassification, it represents a trade-off between acceptable classifier performance and overfitting.
Figure 4
Figure 4
Decision boundary with polynomial kernel. d = 2 (a) and d = 4 (b). K is set to 0.
Figure 5
Figure 5
Decision boundary with RBF kernel. σ = 0.1 (a) and σ = 0.2 (b).
Figure 6
Figure 6
2D illustration of the “searchlight” method on simulated maps of 10 × 10 pixels. For each pixel in the activity map, 5 neighbors (a searchlight) are extracted to form a feature vector. Extracted searchlights from the activity maps of each condition (A or B) form then the input examples. A classifier is trained using training examples (corresponding to the 3 first runs) and tested using the examples of the fourth run. The procedure is then repeated along the activity maps for each pixel to produce finally a performance map that shows how well the signal in the local neighborhoods differentiates the experimental conditions A and B.
Figure 7
Figure 7
Illustration of the Monte Carlo fMRI brain mapping method in one voxel (in black). Instead of centering the search volume (dashed-line circle) at the voxel as in the searchlight method and computing a single performance for it, here the voxel is included in five different constellations with other neighboring voxels (dark gray). In each constellation, a classification performance is computed for it. In the end, the average performance across all the constellations is assigned to the dark voxel.
Figure 8
Figure 8
Mean accuracy after 4-fold cross-validation to classify the data shown in Figure 3. The parameters showing the best accuracy are d = 1 for polynomial kernel and σ ≥ .4 for RBF kernel.
Figure 9
Figure 9
Leave-one-run-out cross-validation (LORO-CV) and leave-one-sample-out cross-validation (LOSO-CV). A classifier is trained using training set (in blue) and then tested using the test set (in red) to get a performance. This procedure is repeated for each run in LORO-CV and for each sample in LOSO-CV to get at the end an averaged performance.
Figure 10
Figure 10
Confusion matrix for performance evaluation.
Figure 11
Figure 11
ROC curve representation.
Figure 12
Figure 12
ROC analysis of unbalanced simulated data. Data in Figure 6 were unbalanced in order to show the threshold effect. (a) ROC curves corresponding to some coordinates (voxels) shown in colored circles in the AUC map in (b).

References

    1. Ogawa S, Lee TM, Kay AR, Tank DW. Brain magnetic resonance imaging with contrast dependent on blood oxygenation. Proceedings of the National Academy of Sciences of the United States of America. 1990;87(24):9868–9872. - PMC - PubMed
    1. Kwong KK, Belliveau JW, Chesler DA, et al. Dynamic magnetic resonance imaging of human brain activity during primary sensory stimulation. Proceedings of the National Academy of Sciences of the United States of America. 1992;89(12):5675–5679. - PMC - PubMed
    1. Logothetis NK, Pauls J, Augath M, Trinath T, Oeltermann A. Neurophysiological investigation of the basis of the fMRI signal. Nature. 2001;412(6843):150–157. - PubMed
    1. Jezzard P, Matthews MP, Smith MS. Functional MRI: an introduction to methods. Journal of Magnetic Resonance Imaging. 2003;17(3):383–383.
    1. Friston KJ, Frith CD, Liddle PF, Frackowiak RSJ. Comparing functional (PET) images: the assessment of significant change. Journal of Cerebral Blood Flow and Metabolism. 1991;11(4):690–699. - PubMed

Publication types