

Insights into the evolution of Darwin's finches from comparative analysis of the Geospiza magnirostris genome sequence
- PMID: 23402223
- PMCID: PMC3575239
- DOI: 10.1186/1471-2164-14-95
Insights into the evolution of Darwin's finches from comparative analysis of the Geospiza magnirostris genome sequence
Abstract
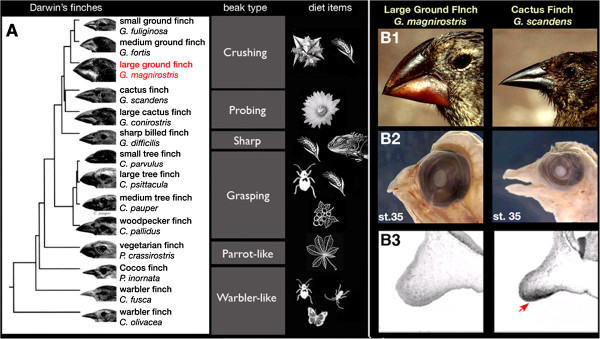
Background: A classical example of repeated speciation coupled with ecological diversification is the evolution of 14 closely related species of Darwin's (Galápagos) finches (Thraupidae, Passeriformes). Their adaptive radiation in the Galápagos archipelago took place in the last 2-3 million years and some of the molecular mechanisms that led to their diversification are now being elucidated. Here we report evolutionary analyses of genome of the large ground finch, Geospiza magnirostris.
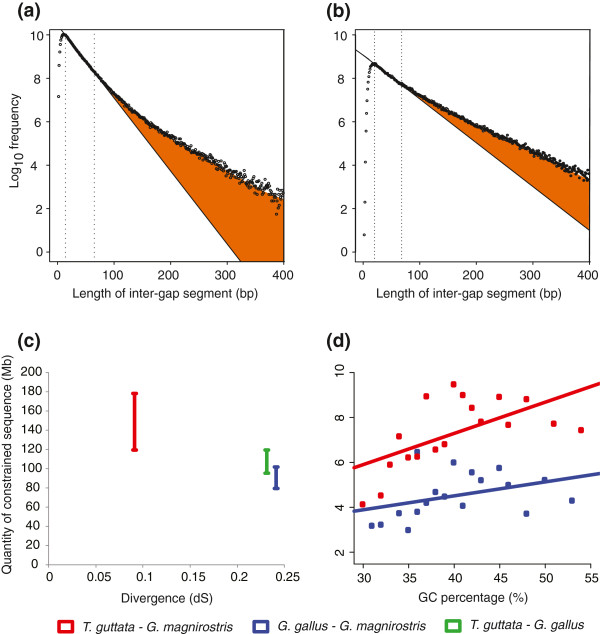
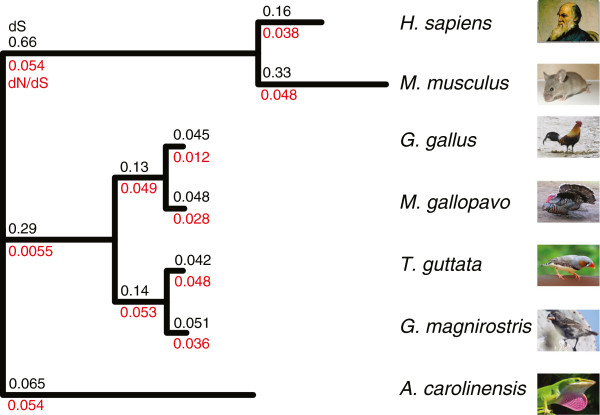
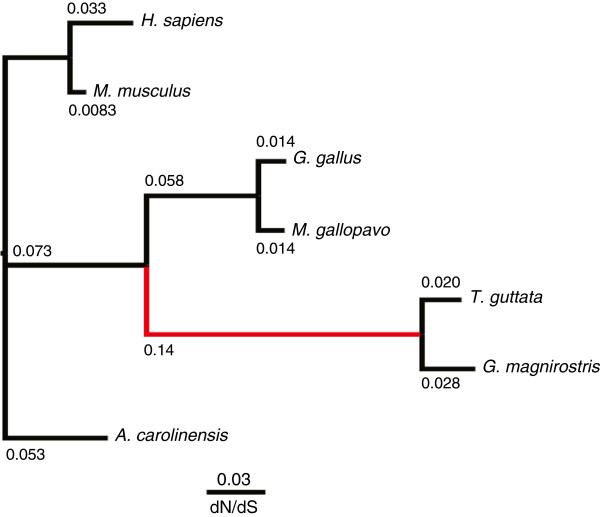
Results: 13,291 protein-coding genes were predicted from a 991.0 Mb G. magnirostris genome assembly. We then defined gene orthology relationships and constructed whole genome alignments between the G. magnirostris and other vertebrate genomes. We estimate that 15% of genomic sequence is functionally constrained between G. magnirostris and zebra finch. Genic evolutionary rate comparisons indicate that similar selective pressures acted along the G. magnirostris and zebra finch lineages suggesting that historical effective population size values have been similar in both lineages. 21 otherwise highly conserved genes were identified that each show evidence for positive selection on amino acid changes in the Darwin's finch lineage. Two of these genes (Igf2r and Pou1f1) have been implicated in beak morphology changes in Darwin's finches. Five of 47 genes showing evidence of positive selection in early passerine evolution have cilia related functions, and may be examples of adaptively evolving reproductive proteins.
Conclusions: These results provide insights into past evolutionary processes that have shaped G. magnirostris genes and its genome, and provide the necessary foundation upon which to build population genomics resources that will shed light on more contemporaneous adaptive and non-adaptive processes that have contributed to the evolution of the Darwin's finches.
Figures

Similar articles
-
Sisyphean evolution in Darwin's finches.Biol Rev Camb Philos Soc. 2015 Aug;90(3):689-98. doi: 10.1111/brv.12127. Epub 2014 Jul 9. Biol Rev Camb Philos Soc. 2015. PMID: 25040800
-
Evolution of Darwin's finches and their beaks revealed by genome sequencing.Nature. 2015 Feb 19;518(7539):371-5. doi: 10.1038/nature14181. Epub 2015 Feb 11. Nature. 2015. PMID: 25686609
-
Ecological and morphological determinants of evolutionary diversification in Darwin's finches and their relatives.Ecol Evol. 2020 Nov 10;10(24):14020-14032. doi: 10.1002/ece3.6994. eCollection 2020 Dec. Ecol Evol. 2020. PMID: 33391699 Free PMC article.
-
Divergence and gene flow among Darwin's finches: A genome-wide view of adaptive radiation driven by interspecies allele sharing.Bioessays. 2015 Sep;37(9):968-74. doi: 10.1002/bies.201500047. Epub 2015 Jul 22. Bioessays. 2015. PMID: 26200327 Free PMC article. Review.
-
Adaptive radiation of Darwin's finches revisited using whole genome sequencing.Bioessays. 2016 Jan;38(1):14-20. doi: 10.1002/bies.201500079. Epub 2015 Nov 25. Bioessays. 2016. PMID: 26606649 Review.
Cited by
-
Third Report on Chicken Genes and Chromosomes 2015.Cytogenet Genome Res. 2015;145(2):78-179. doi: 10.1159/000430927. Epub 2015 Jul 14. Cytogenet Genome Res. 2015. PMID: 26282327 Free PMC article. No abstract available.
-
Social influences on survival and reproduction: Insights from a long-term study of wild baboons.J Anim Ecol. 2019 Jan;88(1):47-66. doi: 10.1111/1365-2656.12887. Epub 2018 Aug 21. J Anim Ecol. 2019. PMID: 30033518 Free PMC article.
-
Identification of an oncogenic network with prognostic and therapeutic value in prostate cancer.Mol Syst Biol. 2018 Aug 14;14(8):e8202. doi: 10.15252/msb.20188202. Mol Syst Biol. 2018. PMID: 30108134 Free PMC article.
-
Growth factor gene IGF1 is associated with bill size in the black-bellied seedcracker Pyrenestes ostrinus.Nat Commun. 2018 Nov 19;9(1):4855. doi: 10.1038/s41467-018-07374-9. Nat Commun. 2018. PMID: 30451848 Free PMC article.
-
Common developmental origins of beak shapes and evolution in theropods.iScience. 2025 Mar 19;28(4):112246. doi: 10.1016/j.isci.2025.112246. eCollection 2025 Apr 18. iScience. 2025. PMID: 40235591 Free PMC article.
References
-
- Darwin C. The Voyage of the Beagle. New York: New American Library; 1988.
-
- Freeman S, Herron J. Evolutionary Analysis. Upper Saddle River, N.J.: CramOutline&Highlight101; 2003.
-
- Barton NH. Evolution. Cold Spring Harbor, N.Y.: Cold Spring Harbor Laboratory Press; 2007.
-
- Futuyma DJ. Evolution. 2. Sunderland, Mass: Sinauer Associates; 2009.
-
- Grant BR, Grant PR. Evolutionary dynamics of a natural population: the large cactus finch of the Galápagos. Chicago: University of Chicago Press; 1989. - PubMed
Publication types
MeSH terms
Grants and funding
LinkOut - more resources
Full Text Sources
Other Literature Sources
Miscellaneous
