. 2013 Feb 12:14:99.
doi: 10.1186/1471-2164-14-99.

Nuclear Factor I genomic binding associates with chromatin boundaries

Affiliations

Nuclear Factor I genomic binding associates with chromatin boundaries

Milos Pjanic et al. BMC Genomics. .

Abstract

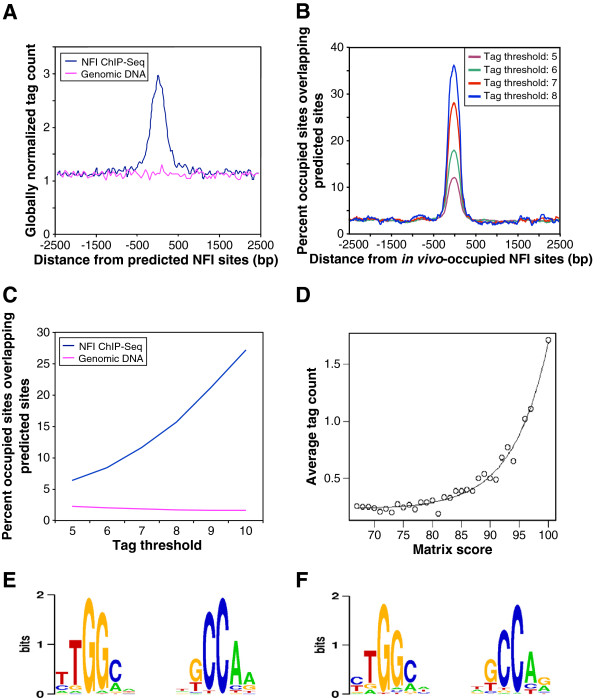
Background: The Nuclear Factor I (NFI) family of DNA binding proteins (also called CCAAT box transcription factors or CTF) is involved in both DNA replication and gene expression regulation. Using chromatin immuno-precipitation and high throughput sequencing (ChIP-Seq), we performed a genome-wide mapping of NFI DNA binding sites in primary mouse embryonic fibroblasts.

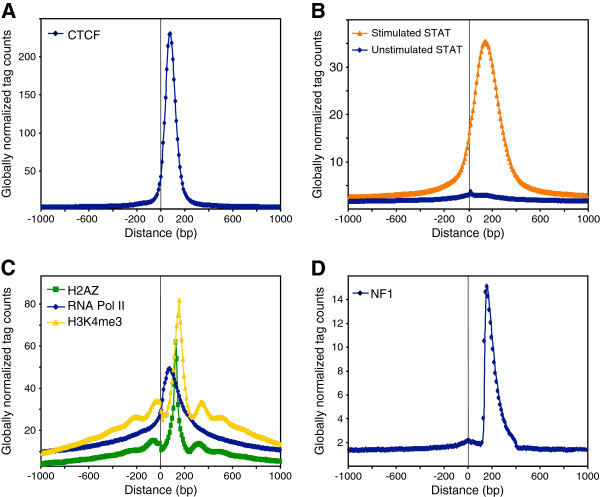
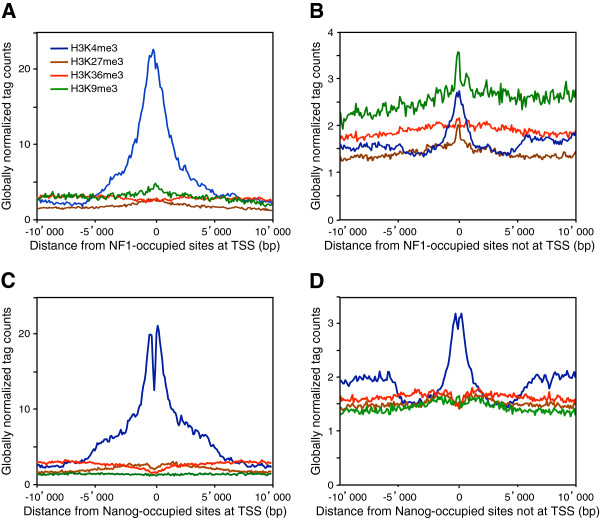
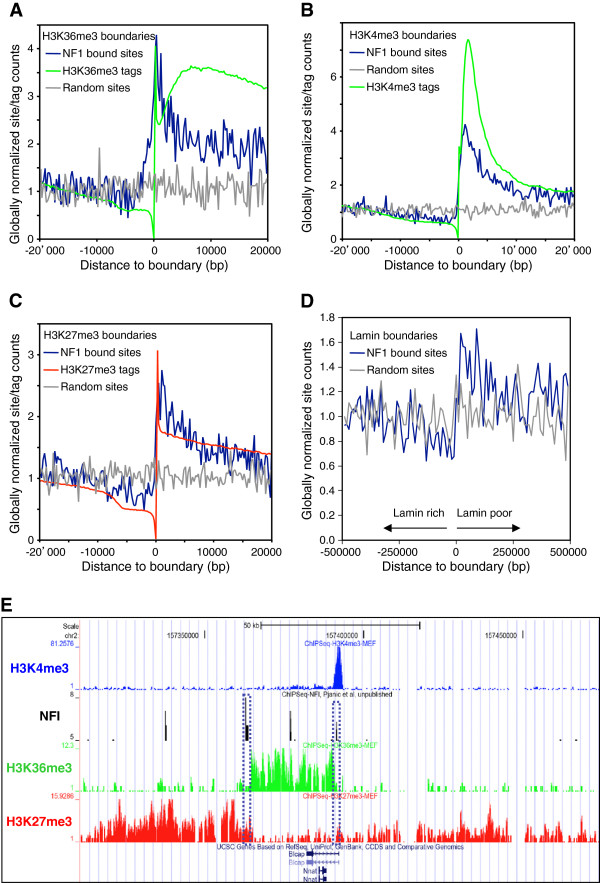
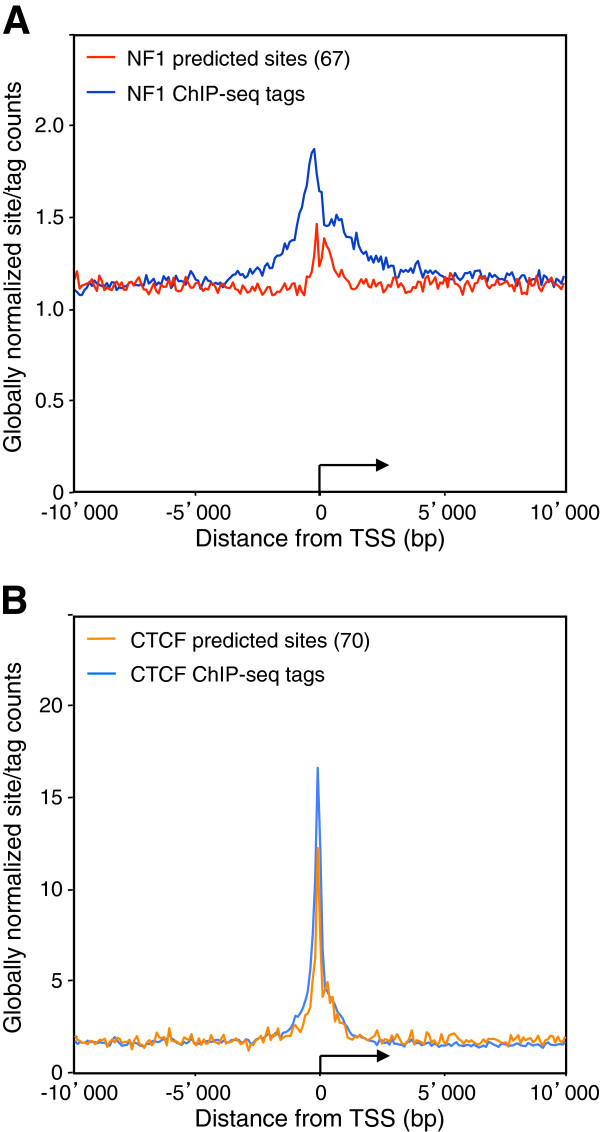
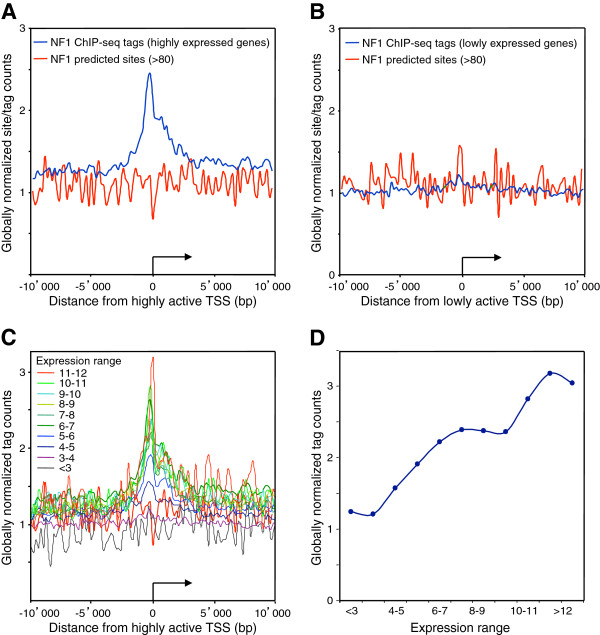
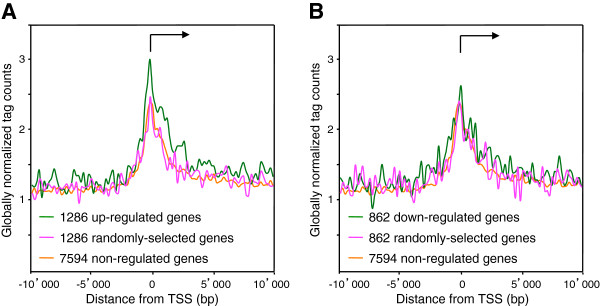
Results: We found that in vivo and in vitro NFI DNA binding specificities are indistinguishable, as in vivo ChIP-Seq NFI binding sites matched predictions based on previously established position weight matrix models of its in vitro binding specificity. Combining ChIP-Seq with mRNA profiling data, we found that NFI preferentially associates with highly expressed genes that it up-regulates, while binding sites were under-represented at expressed but unregulated genes. Genomic binding also correlated with markers of transcribed genes such as histone modifications H3K4me3 and H3K36me3, even outside of annotated transcribed loci, implying NFI in the control of the deposition of these modifications. Positional correlation between + and - strand ChIP-Seq tags revealed that, in contrast to other transcription factors, NFI associates with a nucleosomal length of cleavage-resistant DNA, suggesting an interaction with positioned nucleosomes. In addition, NFI binding prominently occurred at boundaries displaying discontinuities in histone modifications specific of expressed and silent chromatin, such as loci submitted to parental allele-specific imprinted expression.

Conclusions: Our data thus suggest that NFI nucleosomal interaction may contribute to the partitioning of distinct chromatin domains and to epigenetic gene expression regulation.NFI ChIP-Seq and input control DNA data were deposited at Gene Expression Omnibus (GEO) repository under accession number GSE15844. Gene expression microarray data for mouse embryonic fibroblasts are on GEO accession number GSE15871.


Figures

Figure 1
Figure 1
Correlation of modeled NFI binding specificity to genomic binding site occupancy. (A) Density of NFI ChIP-Seq tags in the vicinity of NFI sites predicted by the weight matrix derived from in vitro NFI binding studies. A score threshold of 90 yields 12,209 predicted sites on the mouse genome. Average ChIP-Seq tag counts were calculated in windows of 50 bp for a region of 2.5 kb on each side of the predicted sites. Tag counts were normalized globally as a fold-increase over the genome-wide average tag count in 50 bp windows. (B) In vivo-occupied NFI sites were defined with different tag thresholds: 8 tags yielding 701 sites, 7 tags – 1,642 sites, 6 tags – 4,794 sites, 5 tags – 14,487 sites. The percentage of in vivo NFI sites matching a predicted site was plotted as a function of the distance to the center of the in vivo-occupied sites in windows of 300 bp. NFI predicted sites were defined with the cut-off of 79. (C) Correlation of the tag threshold defining NFI site occupancy and weight matrix predicted sites, defined as fraction of in vivo sites that are overlapping a predicted site. (D) Exponential relation of the average tag count with the score of the position weight matrix. Tags were attributed to the predicted sites as follows: plus strand tags were attributed to the closest downstream predicted site if they were separated by less than 200 bp and minus strand tags were similarly attributed to the closest upstream predicted site. The average tag count was defined as the ratio of the overall tag number covering the predicted sites for a certain class and the number of predicted sites of the class. (E) In vitro NFI binding motif derived from 5579 NFI binding sequences of 25 bp in length obtained from SELEX-SAGE selection [29]. (F) In vivo NFI binding motif derived from 1265 NFI binding sequences of 200 bp in length, obtained from the ChIP-Seq experiment.
Figure 2
Figure 2
Positional correlation of tags mapping on plus and minus strand from other ChIP-Seq experiments. Co-localized tag counts greater than 10 were set to 10 and tags overlapping repeated DNA sequences, as defined by RepeatMasker, were filtered out. Tags mapping on the plus strand were centered to position 0 and the distribution of tags mapping on the minus strand is displayed as a function of the distance to the centered plus strand tags, using ChIP-Seq datasets generated for CTCF (panel A), STAT1 from stimulated and unstimulated cells (B), the H2AZ histone variant, RNA Pol II, and histone H3 tri-methylated on lysine 4 (H3K4me3) (C), or NFI (D).
Figure 3
Figure 3
NFI associates with histone modification H3K4me3. In vivo NFI sites were defined with the threshold of 6 tags yielding 4,794 sites. In vivo NFI sites were separated into two categories: one group (808 sites) mapping to regions +/− 5 kb from transcription start sites (TSS) and another group outside these regions (3,986 sites). The average ChIP-Seq tag counts for different histone modifications were calculated in windows of 100 bp for a region of 10 kb up- and down- stream of the in vivo NFI sites. Tag counts were normalized globally, as a fold-increase over the genome average tag count in a window of 100 bp. In vivo Nanog sites were separated into two categories: mapping into regions +/− 5 kb from transcription start sites (TSS) and outside these regions. The average ChIP-Seq tag counts for different histone modifications were calculated as for NFI. (A) In vivo NFI sites inside TSS +/− 10 kb. (B) In vivo NFI sites outside TSS +/−10 kb. (C) In vivo Nanog sites inside TSS +/− 10 kb. (D) In vivo Nanog sites outside TSS +/− 10 kb.
Figure 4
Figure 4
NFI binding is associated with chromatin and nuclear lamina boundaries. The mouse genome was partitioned into histone modification-poor and enriched segments, and the genomic positions of boundaries featuring transitions from modification-poor to enriched regions were centered and aligned at position 0 of the X-axis, from (A) 14,632 H3K36me3 boundaries, (B) 31,662 H3K4me3 boundaries (C) 29,122 H3K27me3 modification boundaries. The distribution of 4,794 in vivo NFI sites was compared with the distribution of 4,794 randomly chosen genomic positions sampled from each chromosome according to the number of occupied NFI sites. The average numbers of NFI or random sites were normalized globally with the genome-wide average number of sites in 250 bp window. The distribution of NFI and random sites was also aligned to the anchor spots of DNA to the nuclear lamina using 2 kb windows (D), where the arrows indicate the poor and enriched genomic regions for the nuclear lamina lamin B component. (E) Example of NFI in vivo binding sites located at the boundaries of open and close chromatin markers, H3K36me3 and H3K27me3, in mouse embryonic fibroblasts. NFI binding sites define the region of open chromatin surrounding the Blcap and Nnat gene locus. NFI sites at the boundary positions are enclosed with a dotted line.
Figure 5
Figure 5
Increased NFI promoter association does not correlate with high predicted affinity. Average NFI (panel A) or CTCF (panel B) ChIP-Seq tag counts were calculated in windows of 100 bp for regions 10kb up- and down- stream of the RefSeq annotated transcription start sites (TSS). TSS were oriented and the broken arrows indicate the initiation site and the direction of transcription. Tag counts were normalized globally, as a fold increase over the genome-wide average tag count in a window of 100bp. NFI and CTCF predicted site counts were normalized similarly as a fold increase over the genome average site count in a window of 100 bp using the indicated weight matrix cut-off scores.
Figure 6
Figure 6
NFI tag count is increased near transcription start sites of highly-expressed genes. Average NFI ChIP-Seq tag counts were calculated in windows of 200 bp for regions 10 kb up- and down- stream of the RefSeq annotated transcription start sites (TSS). TSS were oriented and the broken arrows indicate the initiation site and the direction of transcription. Tag counts were normalized globally, as a fold increase over the genome average tag count in a window of 200 bp. NFI predicted sites were mapped on the reference mouse genome mm9 with a matrix cut-off score 67. The NFI predicted site count was normalized in the same way, as a fold increase over the average site count in a bin window of 200 bp. (A) Highly-expressed genes with Affymetrix expression levels greater than 8. (B) Low- or non- expressed genes with Affymetrix expression levels lower than 4. Genes were separated into 11 groups according to their Affymetrix expression level (<3, 3–4, 4–5, 5–6, 6–7, 7–8, 8–9, 9–10, 10–11, 11–12, >12). (C) For each of these groups, the average NFI ChIP-Seq tag counts was calculated in windows of 200 bp for regions 10 kb up- and down- stream of the RefSeq annotated transcription start sites (TSS). Tag counts were normalized globally, as a fold increase over the genome average tag count in a window of 200 bp. (D) Peak maxima for each of the gene groups found at the TSS was plotted against the expression level.
Figure 7
Figure 7
Transcription start sites of NFI-C up-regulated genes show the highest occupancy with NFI. (A) Genes were considered to be up-regulated by NFI-C if the difference in Affymetrix expression levels between wild-type and NFI-C knock-out cells was greater than 0.5. We found 1286 genes to be up-regulated by NFI-C. As a negative control we used 1286 randomly chosen genes. (B) Genes were considered to be down-regulated by NFI-C if the difference in Affymetrix expression level between wild-type and NFI-C knock-out cells was lower than −0.5. We found 862 genes to be down-regulated by NFI-C. As a negative control we used 862 randomly chosen genes. In both graphs we used as a negative control NFI-C non-regulated genes with the change in Affymetrix expression level between −0.05 and 0.05. Average NFI ChIP-Seq tag counts were calculated in windows of 200 bp for regions 10 kb up- and down- stream of the oriented transcriptional start sites (TSS). TSS were oriented and the broken arrows indicate the initiation site and the direction of transcription. Tag counts were normalized globally, as a fold-increase over the genome average tag count in a window of 200 bp.

Similar articles

Cited by

  • Deciphering the genetics and mechanisms of predisposition to multiple myeloma.
    Went M, Duran-Lozano L, Halldorsson GH, Gunnell A, Ugidos-Damboriena N, Law P, Ekdahl L, Sud A, Thorleifsson G, Thodberg M, Olafsdottir T, Lamarca-Arrizabalaga A, Cafaro C, Niroula A, Ajore R, Lopez de Lapuente Portilla A, Ali Z, Pertesi M, Goldschmidt H, Stefansdottir L, Kristinsson SY, Stacey SN, Love TJ, Rognvaldsson S, Hajek R, Vodicka P, Pettersson-Kymmer U, Späth F, Schinke C, Van Rhee F, Sulem P, Ferkingstad E, Hjorleifsson Eldjarn G, Mellqvist UH, Jonsdottir I, Morgan G, Sonneveld P, Waage A, Weinhold N, Thomsen H, Försti A, Hansson M, Juul-Vangsted A, Thorsteinsdottir U, Hemminki K, Kaiser M, Rafnar T, Stefansson K, Houlston R, Nilsson B. Went M, et al. Nat Commun. 2024 Aug 5;15(1):6644. doi: 10.1038/s41467-024-50932-7. Nat Commun. 2024. PMID: 39103364 Free PMC article.
  • Overgrowth-intellectual disability disorders: progress in biology, patient advocacy and innovative therapies.
    Atterton C, Trew I, Cale JM, Aung-Htut MT, Grens K, Kiernan J, Delagrammatikas CG, Piper M. Atterton C, et al. Dis Model Mech. 2025 May 1;18(5):dmm052300. doi: 10.1242/dmm.052300. Epub 2025 May 12. Dis Model Mech. 2025. PMID: 40353642 Free PMC article. Review.
  • NFI transcription factors provide chromatin access to maintain stem cell identity while preventing unintended lineage fate choices.
    Adam RC, Yang H, Ge Y, Infarinato NR, Gur-Cohen S, Miao Y, Wang P, Zhao Y, Lu CP, Kim JE, Ko JY, Paik SS, Gronostajski RM, Kim J, Krueger JG, Zheng D, Fuchs E. Adam RC, et al. Nat Cell Biol. 2020 Jun;22(6):640-650. doi: 10.1038/s41556-020-0513-0. Epub 2020 May 11. Nat Cell Biol. 2020. PMID: 32393888 Free PMC article.
  • Differential DNA methylation of vocal and facial anatomy genes in modern humans.
    Gokhman D, Nissim-Rafinia M, Agranat-Tamir L, Housman G, García-Pérez R, Lizano E, Cheronet O, Mallick S, Nieves-Colón MA, Li H, Alpaslan-Roodenberg S, Novak M, Gu H, Osinski JM, Ferrando-Bernal M, Gelabert P, Lipende I, Mjungu D, Kondova I, Bontrop R, Kullmer O, Weber G, Shahar T, Dvir-Ginzberg M, Faerman M, Quillen EE, Meissner A, Lahav Y, Kandel L, Liebergall M, Prada ME, Vidal JM, Gronostajski RM, Stone AC, Yakir B, Lalueza-Fox C, Pinhasi R, Reich D, Marques-Bonet T, Meshorer E, Carmel L. Gokhman D, et al. Nat Commun. 2020 Mar 4;11(1):1189. doi: 10.1038/s41467-020-15020-6. Nat Commun. 2020. PMID: 32132541 Free PMC article.
  • Positional plasticity in regenerating Amybstoma mexicanum limbs is associated with cell proliferation and pathways of cellular differentiation.
    McCusker CD, Athippozhy A, Diaz-Castillo C, Fowlkes C, Gardiner DM, Voss SR. McCusker CD, et al. BMC Dev Biol. 2015 Nov 23;15:45. doi: 10.1186/s12861-015-0095-4. BMC Dev Biol. 2015. PMID: 26597593 Free PMC article.

References

    1. Nagata K, Guggenheimer RA, Enomoto T, Lichy JH, Hurwitz J. Adenovirus DNA replication in vitro: identification of a host factor that stimulates synthesis of the preterminal protein-dCMP complex. Proc Natl Acad Sci USA. 1982;79(21):6438–6442. doi: 10.1073/pnas.79.21.6438. - DOI - PMC - PubMed
    1. Chen M, Mermod N, Horwitz MS. Protein-protein interactions between adenovirus DNA polymerase and nuclear factor I mediate formation of the DNA replication preinitiation complex. J Biol Chem. 1990;265(30):18634–18642. - PubMed
    1. Armentero MT, Horwitz M, Mermod N. Targeting of DNA polymerase to the adenovirus origin of DNA replication by interaction with nuclear factor I. Proc Natl Acad Sci USA. 1994;91(24):11537–11541. doi: 10.1073/pnas.91.24.11537. - DOI - PMC - PubMed
    1. de Jong RN, van der Vliet PC. Mechanism of DNA replication in eukaryotic cells: cellular host factors stimulating adenovirus DNA replication. Gene. 1999;236(1):1–12. doi: 10.1016/S0378-1119(99)00249-8. - DOI - PubMed
    1. Santoro C, Mermod N, Andrews PC, Tjian R. A family of human CCAAT-box-binding proteins active in transcription and DNA replication: cloning and expression of multiple cDNAs. Nature. 1988;334(6179):218–224. doi: 10.1038/334218a0. - DOI - PubMed

Publication types

MeSH terms

Associated data