. 2013 Feb 13:13:26.
doi: 10.1186/1471-2229-13-26.

Common bean (Phaseolus vulgaris L.) PvTIFY orchestrates global changes in transcript profile response to jasmonate and phosphorus deficiency

Affiliations

Common bean (Phaseolus vulgaris L.) PvTIFY orchestrates global changes in transcript profile response to jasmonate and phosphorus deficiency

Rosaura Aparicio-Fabre et al. BMC Plant Biol. .

Abstract

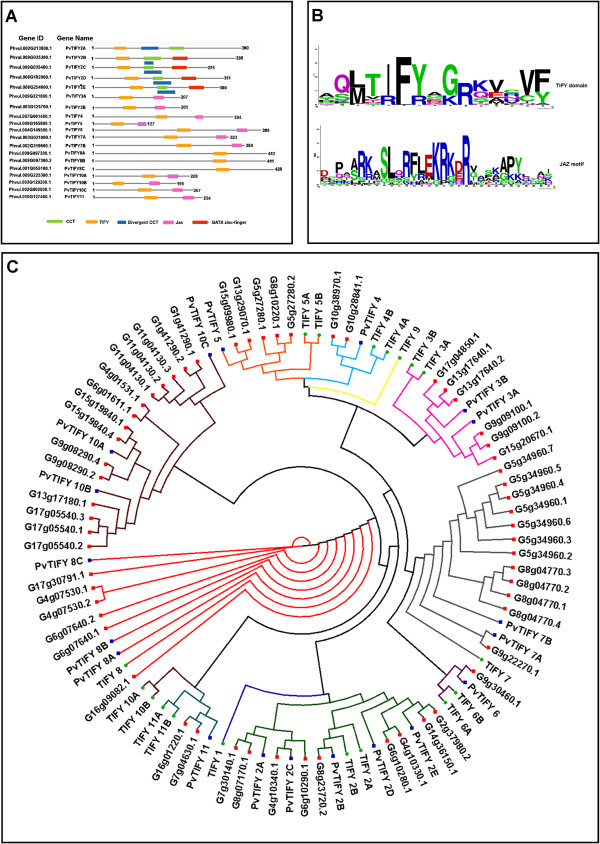
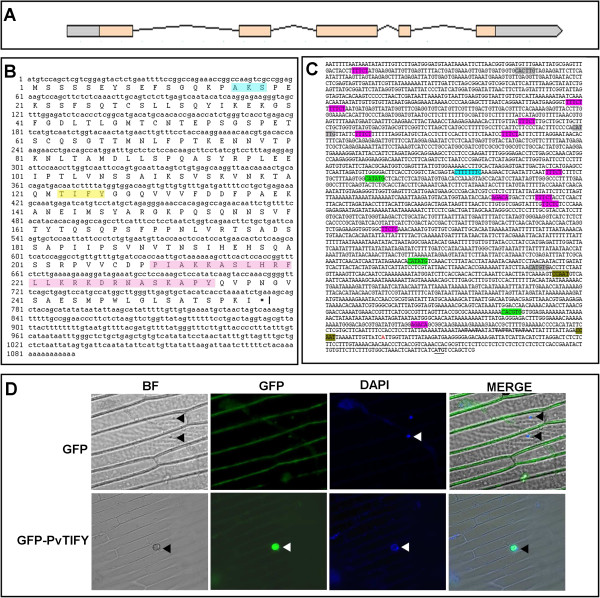
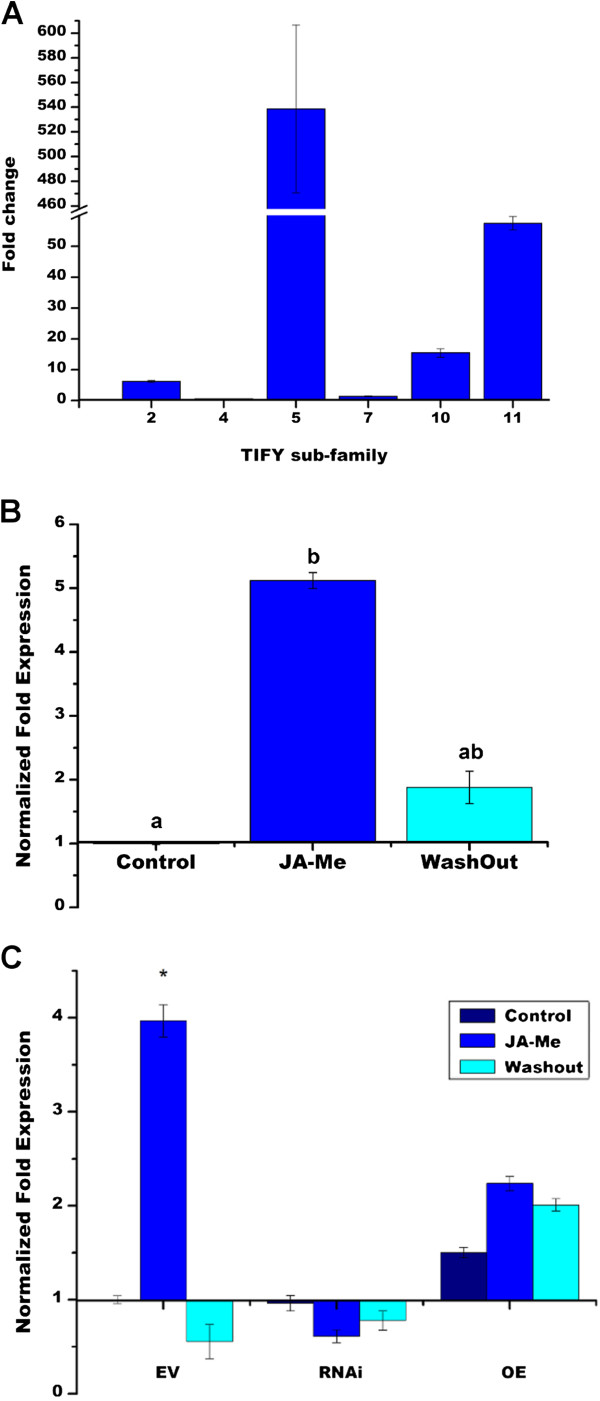
Background: TIFY is a large plant-specific transcription factor gene family. A subgroup of TIFY genes named JAZ (Jasmonate-ZIM domain) has been identified as repressors of jasmonate (JA)-regulated transcription in Arabidopsis and other plants. JA signaling is involved in many aspects of plant growth/development and in defense responses to biotic and abiotic stresses. Here, we identified the TIFY genes (designated PvTIFY) from the legume common bean (Phaseolus vulgaris) and functionally characterized PvTIFY10C as a transcriptional regulator.

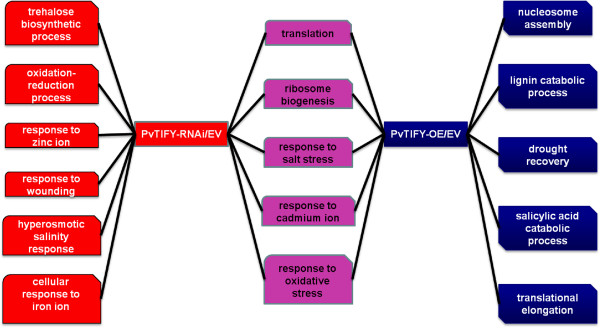
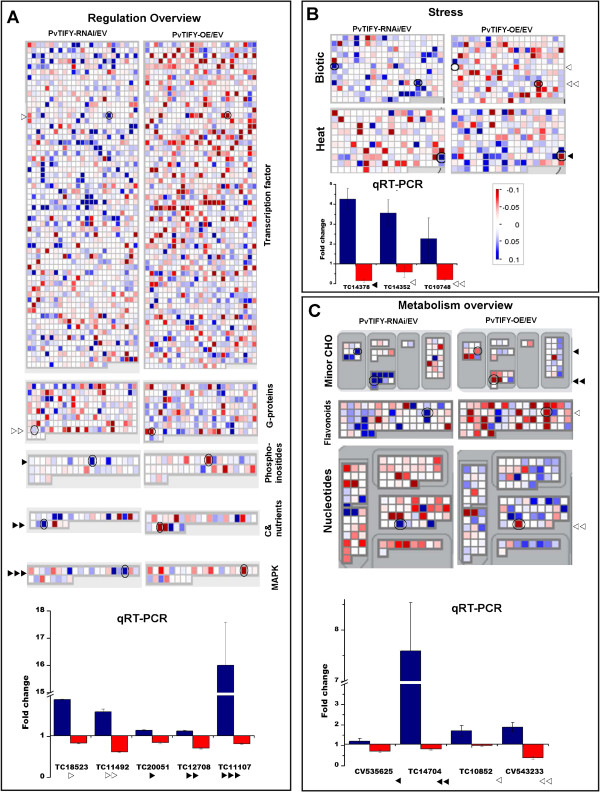
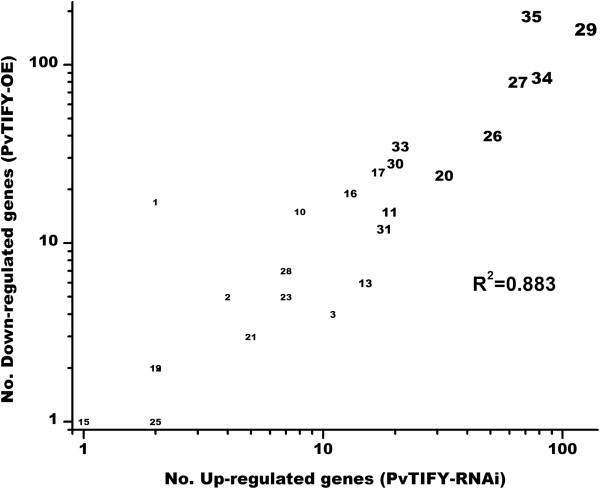
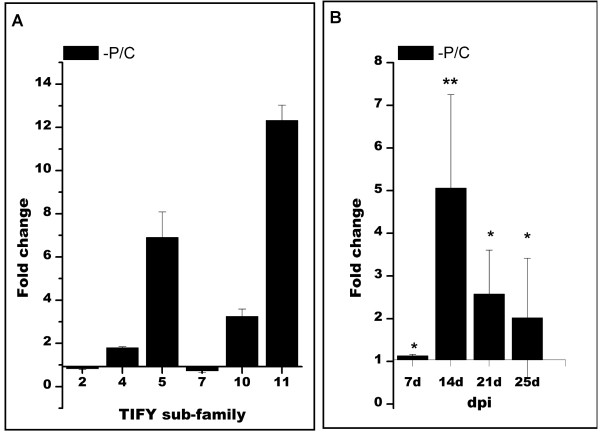
Results: Nineteen genes from the PvTIFY gene family were identified through whole-genome sequence analysis. Most of these were induced upon methyl-JA elicitation. We selected PvTIFY10C as a representative JA-responsive PvTIFY gene for further functional analysis. Transcriptome analysis via microarray hybridization using the newly designed Bean Custom Array 90 K was performed on transgenic roots of composite plants with modulated (RNAi-silencing or over-expression) PvTIFY10C gene expression. Data were interpreted using Gene Ontology and MapMan adapted to common bean. Microarray differential gene expression data were validated by real-time qRT-PCR expression analysis. Comparative global gene expression analysis revealed opposite regulatory changes in processes such as RNA and protein regulation, stress responses and metabolism in PvTIFY10C silenced vs. over-expressing roots. These data point to transcript reprogramming (mainly repression) orchestrated by PvTIFY10C. In addition, we found that several PvTIFY genes, as well as genes from the JA biosynthetic pathway, responded to P-deficiency. Relevant P-responsive genes that participate in carbon metabolic pathways, cell wall synthesis, lipid metabolism, transport, DNA, RNA and protein regulation, and signaling were oppositely-regulated in control vs. PvTIFY10C-silenced roots of composite plants under P-stress. These data indicate that PvTIFY10C regulates, directly or indirectly, the expression of some P-responsive genes; this process could be mediated by JA-signaling.

Conclusion: Our work contributes to the functional characterization of PvTIFY transcriptional regulators in common bean, an agronomically important legume. Members from the large PvTIFY gene family are important global transcriptional regulators that could participate as repressors in the JA signaling pathway. In addition, we propose that the JA-signaling pathway involving PvTIFY genes might play a role in regulating the plant response/adaptation to P-starvation.


Figures

Figure 1
Figure 1
Sequence and structural comparison of TIFY family members. (A) Structural organization of the identified P. vulgaris TIFY genes. Conserved motifs: CCT, TIFY, divergent CCT, Jas and GATA zinc-finger, are depicted in colored boxes assigned as indicated at the bottom of the panel. The genes are denoted by their species (Pv) abbreviation followed by the gene name; transcript IDs [4] are also provided. (B) WebLogo [38] of the putative TIFY and JAS motifs constructed from appropriate subsets of the sequence alignment of 23 bean TIFY sequences with Arabidopsis homologs. For the Jas motif analysis the TIFY2 family, which lacks this motif, was excluded. (C) Phylogenetic tree of the TIFY family. Protein sequences were aligned using ClustalX. A neighbor-joining tree was constructed using the PHYLIP package from 18, 58 and 19 amino acid sequences of TIFY family members from A. thaliana, G. max and P. vulgaris, respectively. The branches are color-coded to indicate their phyletic association to the Arabidopsis TIFY classification. A green, red or blue dot at the end of each branch indicates genes from A. thaliana, G. max or P. vulgaris, respectively.
Figure 2
Figure 2
Structural organization and cellular localization of PvTIFY10C. (A) PvTIFY10C gene structure. Exon regions are indicated with salmon-colored boxes, introns with black lines, and 5 and 3 UTRs with gray boxes. (B) Deduced amino acid sequence of PvTIFY10C. A predicted sumoylation site is shaded in blue. The TIFY domain is shaded in yellow. The Jas motive is shaded in pink. (C) The promoter region includes important regulatory cis-elements: CCAAT motifs (brown) at −15 and −713, G-boxes (CATATG; green) at −267, -911 and −1923, E-boxes (CANNTG; gray) at −798, 2474 and 3189, HUD (Hormone Up at Dawn; pink) elements at −41, -1304, -1563, -1642, -1655, -1947, -2785, -2788, -2791 and −3240, and a JA-responsive element (CTTTTNTC) at −1973. (D) PvTIFY10C is located in the nucleus. Onion epidermal cells were transiently transformed with a 35S:PvTIFY-GFP (GFP-TIFY) construct or with an empty vector (GFP). Epifluorescence (GFP, DAPI and MERGE) and bright-field (BF) images were captured of onion epidermal cells. Arrowheads indicate nuclei.
Figure 3
Figure 3
Expression of PvTIFY genes upon JA elicitation. (A) n-Fold expression of PvTIFY genes from different subfamilies in common bean roots incubated with Me-JA. (BC) Normalized n-fold expression of the PvTIFY10C gene in wild type (B) and transgenic (C) bean roots without Me-JA (time 0, control media; dark blue) or incubated with Me-JA for 30 min (blue). After incubation, Me-JA was depleted from the nutrient solution and 12 h later gene expression was determined (turquoise). Values are normalized to the value from the control conditions (without Me-JA), which was set to 1. Transgenic roots derived from composite bean plants transformed with pPvTIFY-RNAi or pPvTIFY-OE are indicated. Values represent the average of three biological replicates. Asterisks or different letters represent significantly different means according to statistical analysis (p < 0.05).
Figure 4
Figure 4
Significantly over-represented biological processes according to Gene Ontology in the responsive EST sets from PvTIFY-RNAi (red) and PvTIFY-OE transgenic roots (blue). Biological processes over-represented in both EST sets are shown in pink.
Figure 5
Figure 5
Transcript profiles of PvTIFY-RNAi and PvTIFY-OE transgenic roots compared with EV (control) transgenic roots. MapMan maps of processes belonging to the regulation overview (A), stress response (B) and metabolism overview (C) categories are shown. In each map, the left panel shows PvTIFY-RNAi/EV expression ratios and the right panel shows PvTIFY-OE/EV, as indicated. Up- or down-regulated ESTs are false color-coded with increasing blue or red, respectively, saturating at amplitude of 0.1 (log2 value) as indicated in the bar from panel B. ESTs with no significant change in amplitude are shown in white. Expression ratios of selected ESTs obtained from microarrays (maps) were validated by qRT-PCR analysis. Normalized data from qRT-PCR gene expression assays are shown in bar-graphs at the bottom of panels A, B and C. The ESTs selected for qRT-PCR analysis correspond to the circled squares from each map and are indicated with black and white arrowheads. The arrowheads in the maps correspond to those in the bar-graphs. The ESTs ID [46] are indicated in the x-axes of the bar-graphs. In each pair of bars, the blue bar corresponds to the PvTIFY-RNAi/EV expression ratio (left in the maps) and the red bar corresponds to the PvTIFY-OE/EV expression ratio (right in the maps). The annotations for the selected ESTs are mentioned in the text.
Figure 6
Figure 6
Correlation between the genes up-regulated in PvTIFY-RNAi and down-regulated in PvTIFY-OE transgenic roots. ESTs significantly up-regulated in PvTIFY-RNAi/EV or down-regulated PvTIFY/EV expression ratios were considered. Data were extracted from the MapMan [37] Venn diagram workflow visualization (threshold fold change [log2] of 0.1 or −0.1). The bubble chart was constructed using the row numbers of functional categories (BINs). The size of the numbers denotes number of ESTs showing a significance response at the selected amplitude (≥ 0.1).
Figure 7
Figure 7
Expression of PvTIFY genes in response to P-deficiency.n-Fold expression of PvTIFY genes from different subfamilies (A) and the PvTIFY10C gene (B) in common bean roots of plants grown in P-deficient conditions (−P) compared with roots from C plants (full-nutrient conditions). A Expression of PvTIFY genes was determined in roots from plants grown for 25 days. BPvTIFY10C expression was determined in roots at different stages of development, as indicated (d = days after planting). Values represent the average of three biological replicates. Asterisks represent significantly different means compared with the control conditions, according to statistical analysis (p < 0.05).

Similar articles

Cited by

References

    1. Libault M, Joshi T, Benedito VA, Xu D, Udvardi MK, Stacey G. Legume transcription factor genes: what makes legume so special? Plant Physiol. 2009;151:991–1001. doi: 10.1104/pp.109.144105. - DOI - PMC - PubMed
    1. Broughton WJ, Hernández G, Blair M, Beebe S, Gepts P, Vanderleyden J. Beans (Phaseolus spp.) – model food legumes. Plant Soil. 2003;252:55–128.
    1. Goodstein DM, Shu S, Howson R, Neupane R, Hayes RD, Fazo J, Mitros T, Dirks W, Hellsten U, Putnam N, Rokhsar DS. Phytozome: a comparative platform for green plant genomics. Nucleic Acids Res. 2012;40:D1178–D1186. doi: 10.1093/nar/gkr944. - DOI - PMC - PubMed
    1. Phaseolus vulgaris v1.0. DOE-JGI and USDA-NIFA; http://www.phytozome.net/commonbean.
    1. Hernández G, Ramírez M, Valdés-López O, Tesfaye M, Graham MA, Czechowski T, Schlereth A, Wandrey M, Erban A, Cheung F, Wu HC, Lara M, Town CD, Kopka J, Udvardi MK, Vance CP. Phosphorus stress in common bean: root transcript and metabolic responses. Plant Physiol. 2007;144:752–767. doi: 10.1104/pp.107.096958. - DOI - PMC - PubMed

Publication types

MeSH terms

LinkOut - more resources