

Revolving door action of breast cancer resistance protein (BCRP) facilitates or controls the efflux of flavone glucuronides from UGT1A9-overexpressing HeLa cells
- PMID: 23402418
- PMCID: PMC4030725
- DOI: 10.1021/mp300562q
Revolving door action of breast cancer resistance protein (BCRP) facilitates or controls the efflux of flavone glucuronides from UGT1A9-overexpressing HeLa cells
Abstract
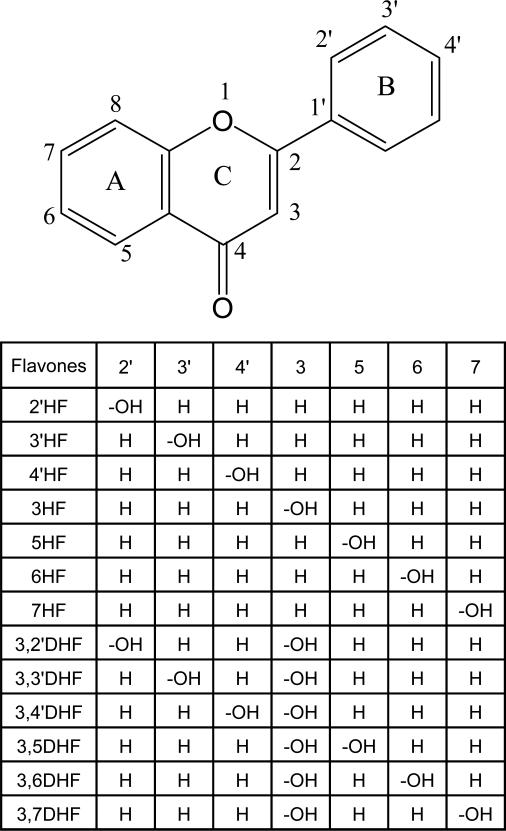
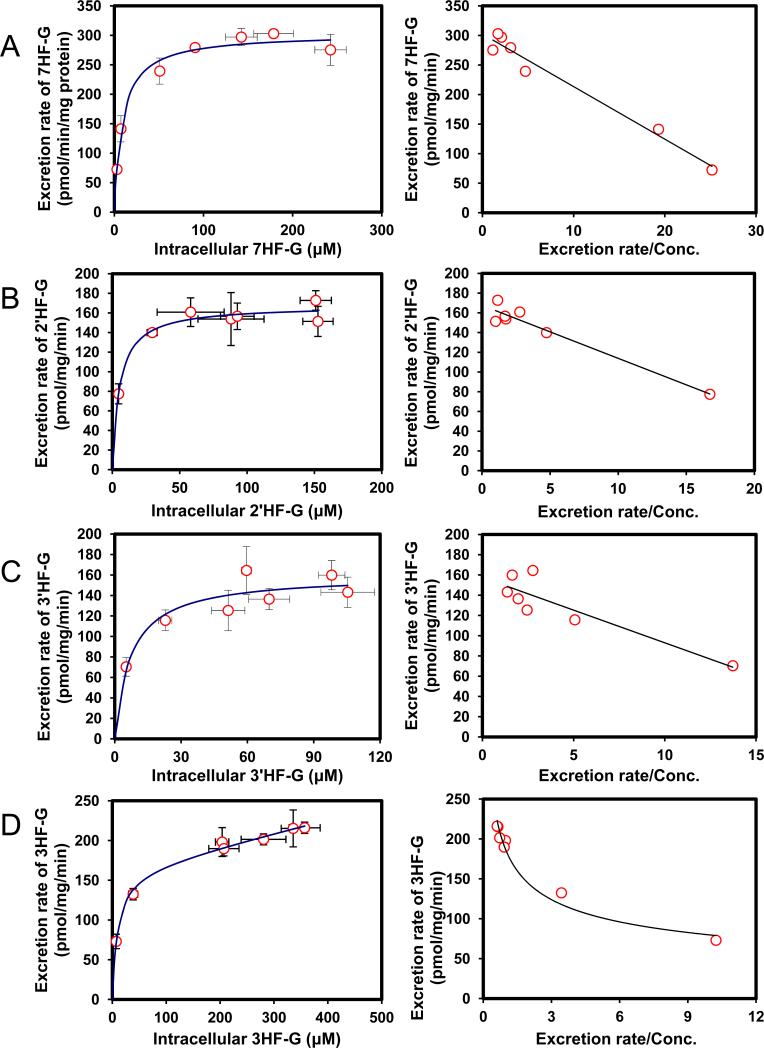
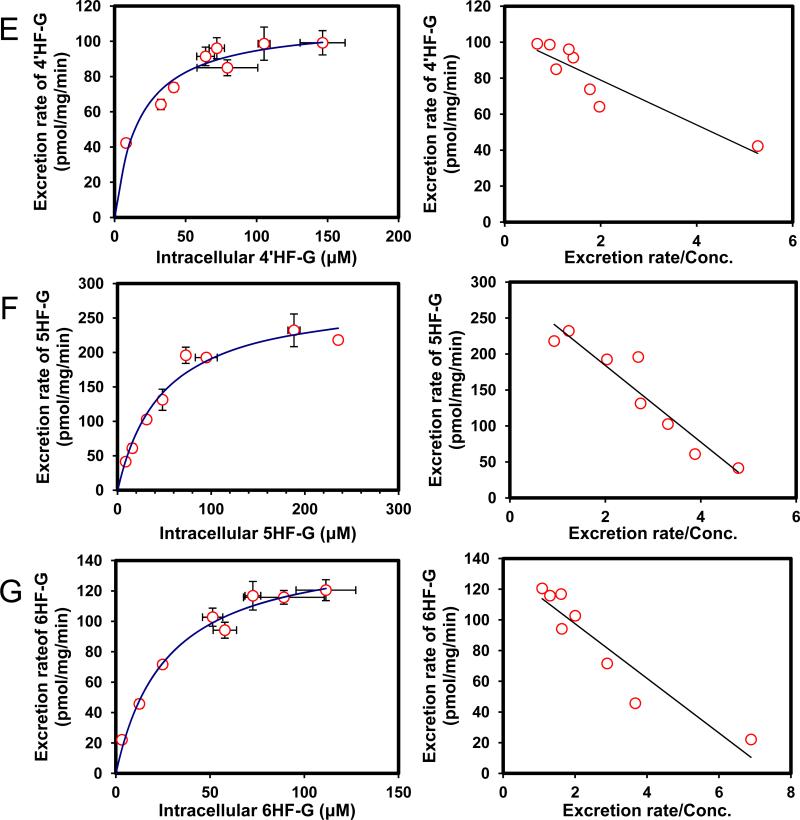
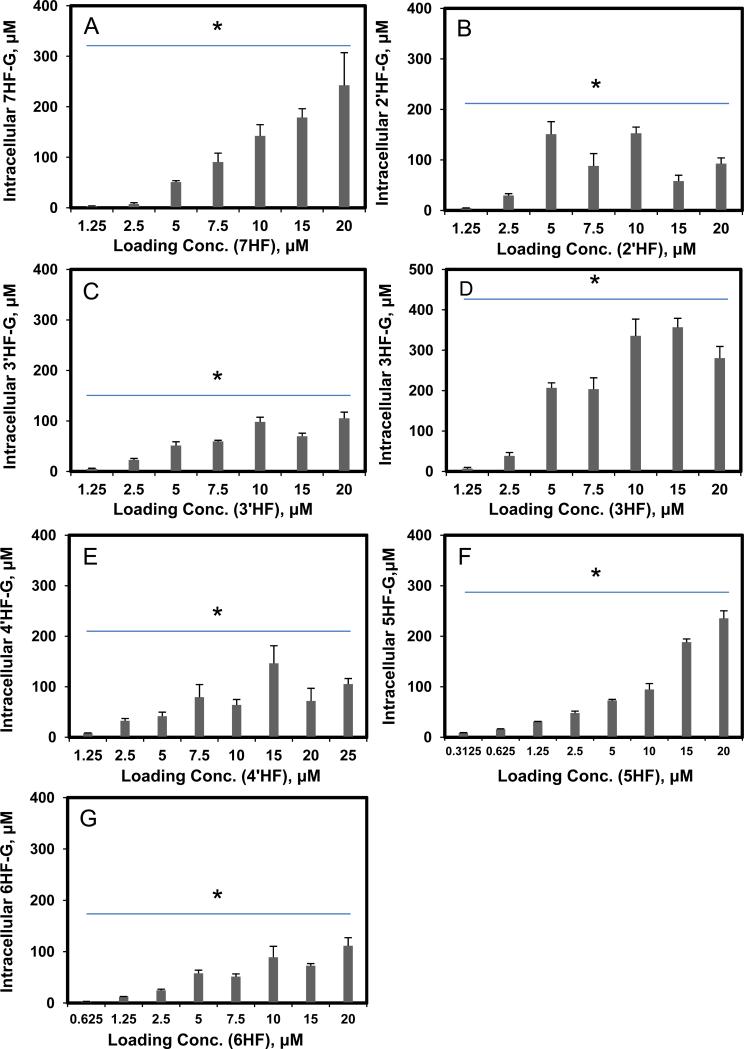
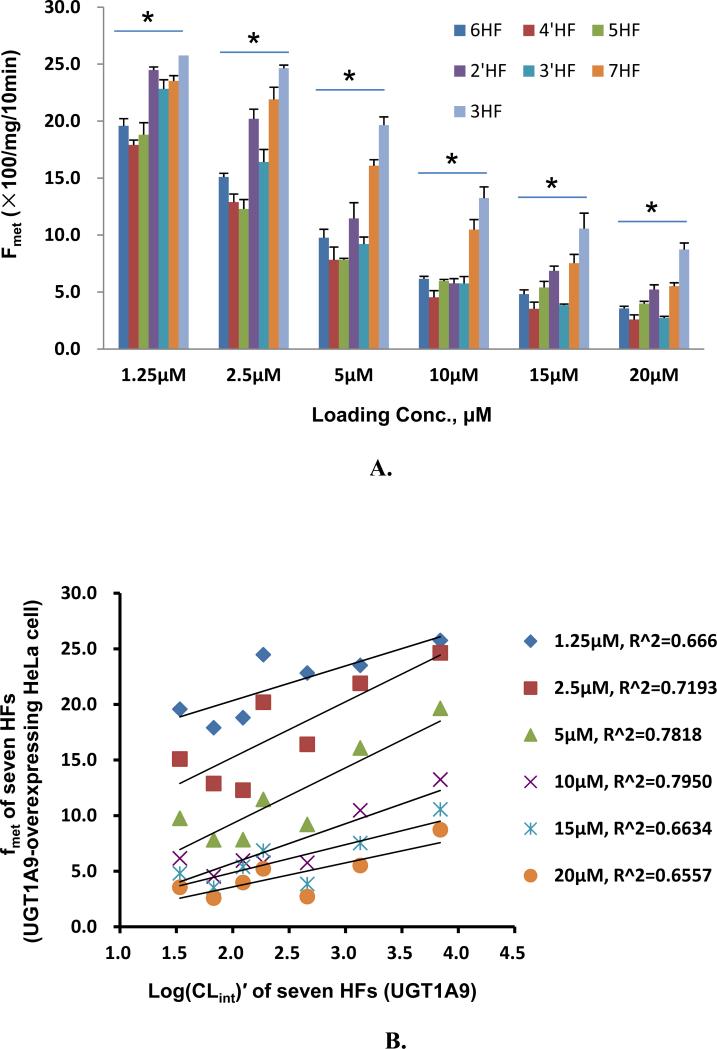
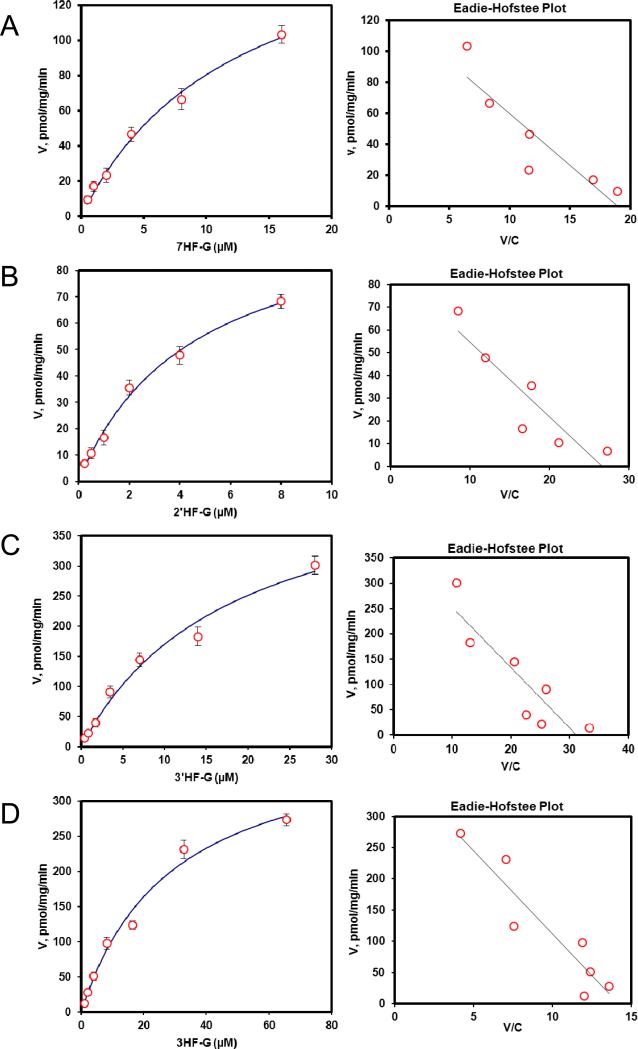
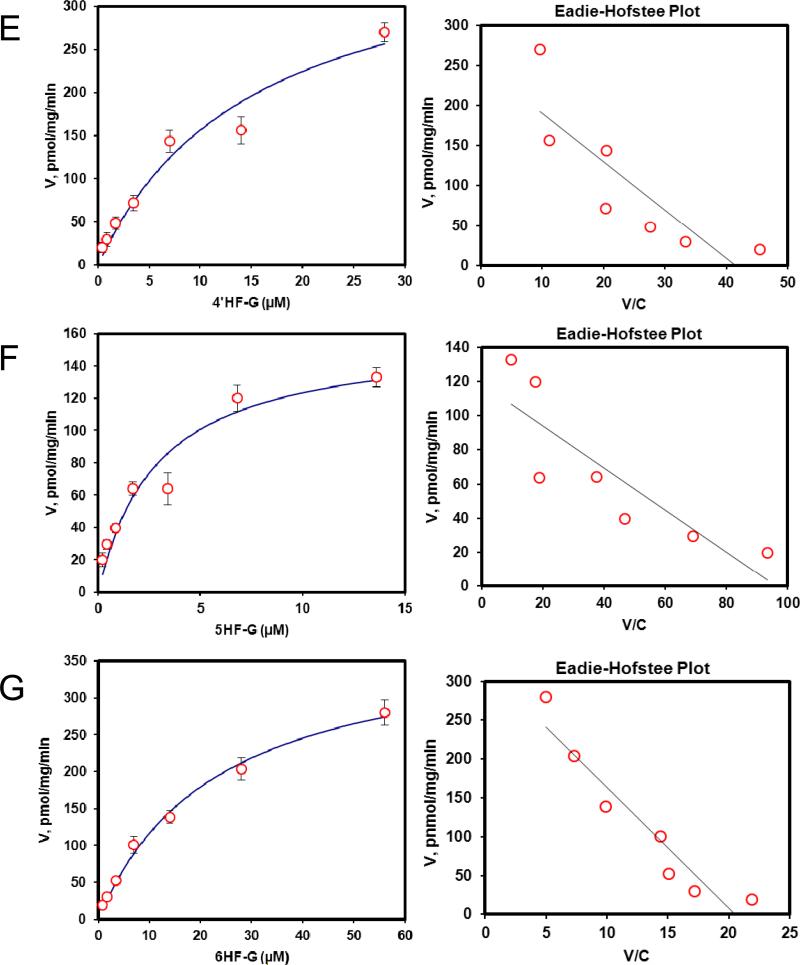
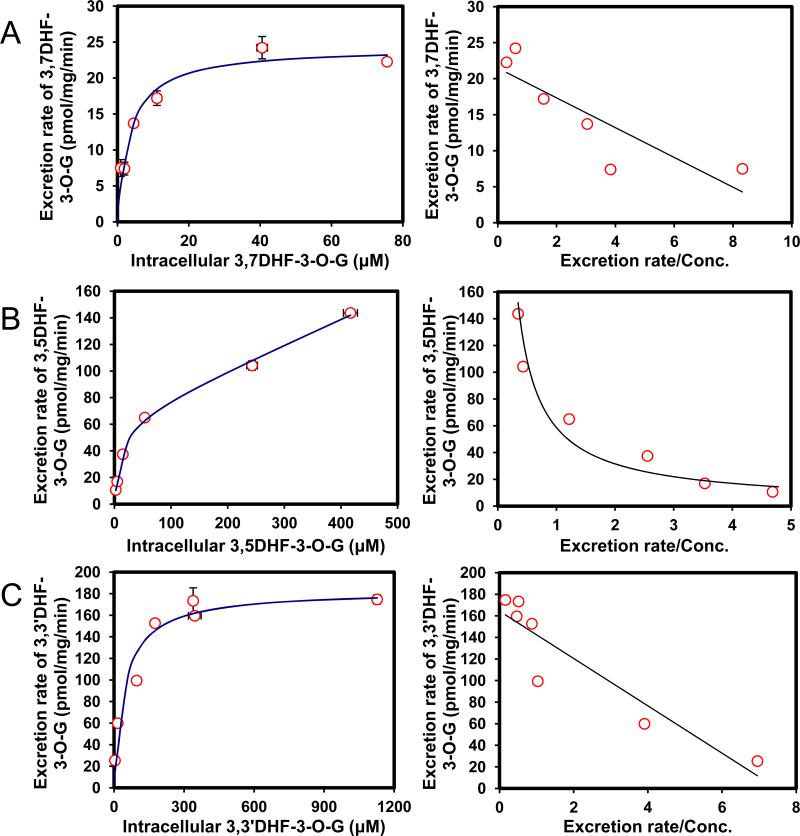
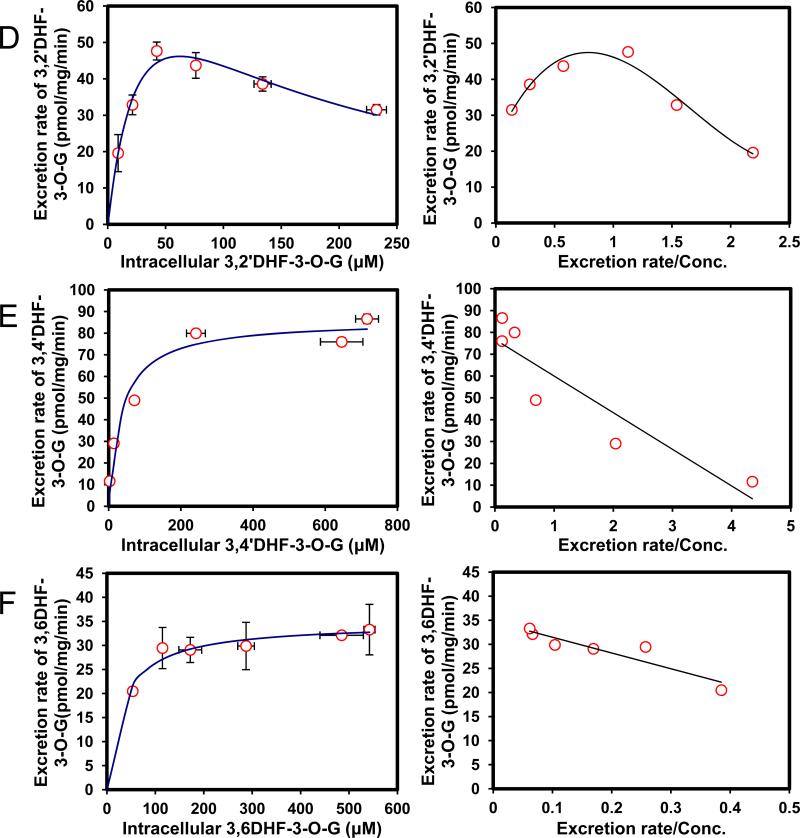
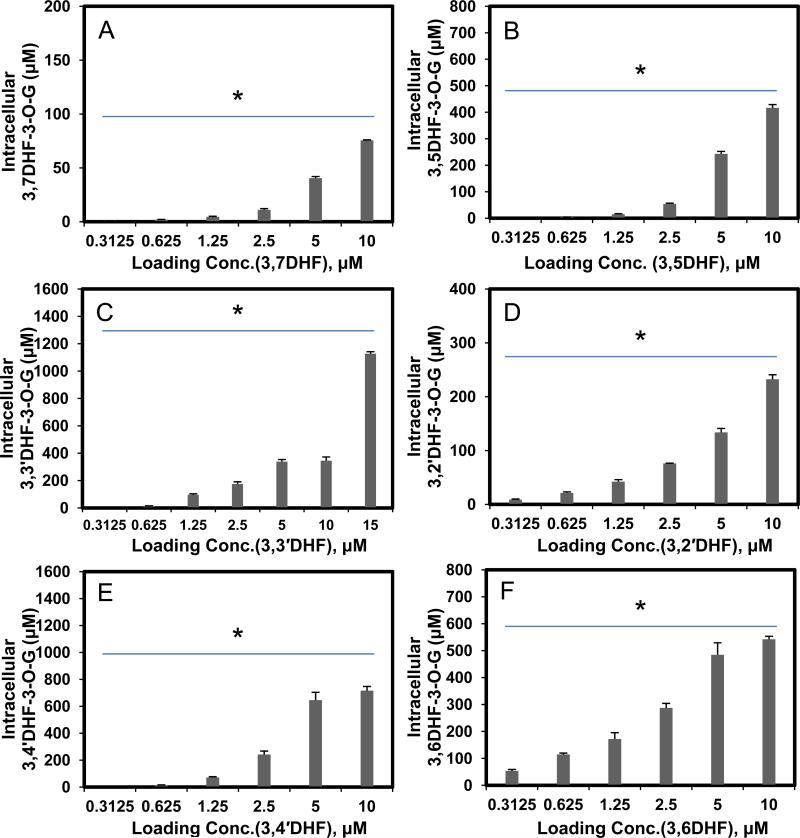
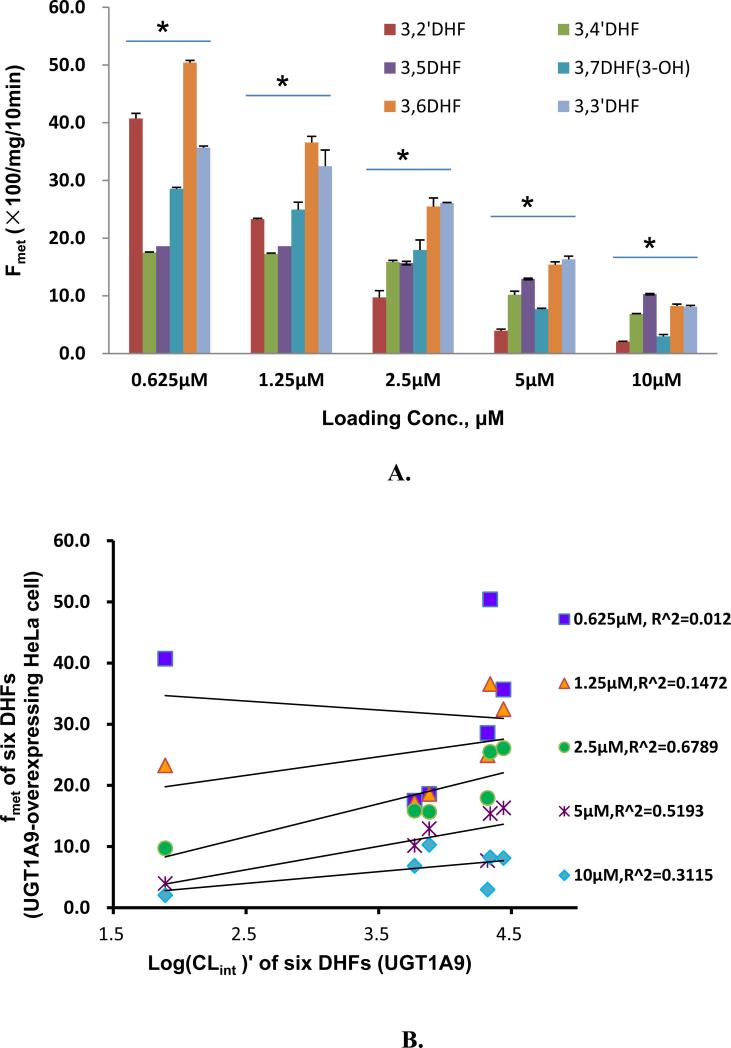
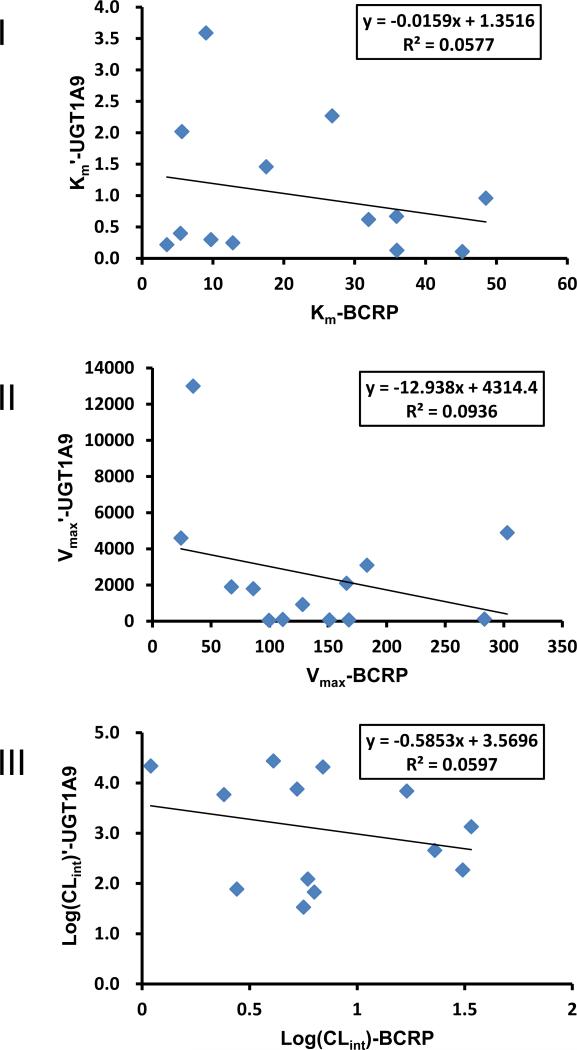
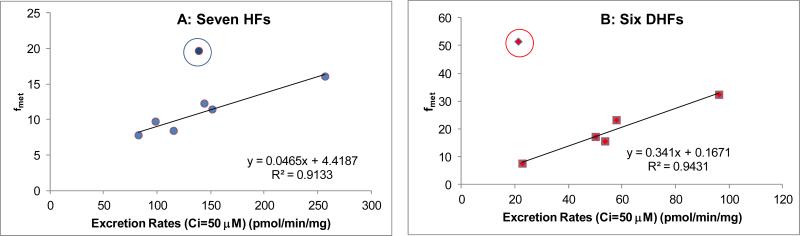
Cellular production of flavonoid glucuronides requires the action of both UDP-glucuronosyltransferases (UGT) and efflux transporters since glucuronides are too hydrophilic to diffuse across the cellular membrane. We determined the kinetics of efflux of 13 flavonoid glucuronides using the newly developed HeLa-UGT1A9 cells and correlated them with kinetic parameters derived using expressed UGT1A9. The results indicated that, among the seven monohydroxylflavones (HFs), there was moderately good correlation (r(2) ≥ 0.65) between the fraction metabolized (fmet) derived from HeLa-UGT1A9 cells and CLint derived from the UGT1A9-mediated metabolism. However, there was weak or no correlation between these two parameters for six dihydroxylflavones (DHFs). Furthermore, there was weak or no correlation between various kinetic parameters (Km, Vmax, or CLint) for the efflux and the metabolism regardless of whether we were using seven HFs, six DHFs, or a combination thereof. Instead, the cellular excretion of many flavonoid glucuronides appears to be controlled by the efflux transporter, and the poor affinity of glucuronide to the efflux transporter resulted in major intracellular accumulation of glucuronides to a level that is above the dosing concentration of its aglycone. Hence, the efflux transporters appear to act as the "Revolving Door" to control the cellular excretion of glucuronides. In conclusion, the determination of a flavonoid's susceptibility to glucuronidation must be based on both its susceptibility to glucuronidation by the enzyme and resulting glucuronide's affinity to the relevant efflux transporters, which act as the "Revolving Door(s)" to facilitate or control its removal from the cells.
Figures
Similar articles
-
Glucuronidation: driving factors and their impact on glucuronide disposition.Drug Metab Rev. 2017 May;49(2):105-138. doi: 10.1080/03602532.2017.1293682. Epub 2017 May 22. Drug Metab Rev. 2017. PMID: 28266877 Free PMC article. Review.
-
UDP-glucuronosyltransferase (UGT) 1A9-overexpressing HeLa cells is an appropriate tool to delineate the kinetic interplay between breast cancer resistance protein (BRCP) and UGT and to rapidly identify the glucuronide substrates of BCRP.Drug Metab Dispos. 2012 Feb;40(2):336-45. doi: 10.1124/dmd.111.041467. Epub 2011 Nov 9. Drug Metab Dispos. 2012. PMID: 22071170 Free PMC article.
-
Overexpression of MRP3 in HeLa-UGT1A9 Cells Enhances Glucuronidation Capability of the Cells.Curr Drug Metab. 2021;22(10):772-783. doi: 10.2174/1389200222666210716151520. Curr Drug Metab. 2021. PMID: 34279197
-
Identification of UGTs and BCRP as potential pharmacokinetic determinants of the natural flavonoid alpinetin.Xenobiotica. 2019 Mar;49(3):276-283. doi: 10.1080/00498254.2018.1440657. Epub 2018 Feb 27. Xenobiotica. 2019. PMID: 29436891
-
Breast cancer resistance protein-mediated efflux of luteolin glucuronides in HeLa cells overexpressing UDP-glucuronosyltransferase 1A9.Pharm Res. 2014 Apr;31(4):847-60. doi: 10.1007/s11095-013-1207-0. Epub 2013 Oct 3. Pharm Res. 2014. PMID: 24092055
Cited by
-
Triple Recycling Processes Impact Systemic and Local Bioavailability of Orally Administered Flavonoids.AAPS J. 2015 May;17(3):723-36. doi: 10.1208/s12248-015-9732-x. Epub 2015 Mar 12. AAPS J. 2015. PMID: 25762448 Free PMC article.
-
Establishment and use of new MDCK II cells overexpressing both UGT1A1 and MRP2 to characterize flavonoid metabolism via the glucuronidation pathway.Mol Nutr Food Res. 2016 Sep;60(9):1967-83. doi: 10.1002/mnfr.201500321. Epub 2016 Jul 6. Mol Nutr Food Res. 2016. PMID: 26833852 Free PMC article.
-
Glucuronidation: driving factors and their impact on glucuronide disposition.Drug Metab Rev. 2017 May;49(2):105-138. doi: 10.1080/03602532.2017.1293682. Epub 2017 May 22. Drug Metab Rev. 2017. PMID: 28266877 Free PMC article. Review.
-
Matrix Effects of the Hydroethanolic Extract of Calyces of Physalis peruviana L. on Rutin Pharmacokinetics in Wistar Rats Using Population Modeling.Pharmaceutics. 2021 Apr 12;13(4):535. doi: 10.3390/pharmaceutics13040535. Pharmaceutics. 2021. PMID: 33921404 Free PMC article.
-
Functionalised Mn(VI)-nanoparticles: an advanced high-valent magnetic catalyst.Sci Rep. 2015 Mar 2;5:8636. doi: 10.1038/srep08636. Sci Rep. 2015. PMID: 25727767 Free PMC article.
References
-
- Fedejko B, Mazerska Z. [UDP-glucuronyltransferases in detoxification and activation metabolism of endogenous compounds and xenobiotics]. Postepy Biochem. 2011;57:49–62. - PubMed
-
- Bock KW, Bock-Hennig BS. UDP-glucuronosyltransferases (UGTs): from purification of Ah-receptor-inducible UGT1A6 to coordinate regulation of subsets of CYPs, UGTs, and ABC transporters by nuclear receptors. Drug Metab. Rev. 2010;42:6–13. - PubMed
-
- Gregory PA, Lewinsky RH, Gardner-Stephen DA, Mackenzie PI. Regulation of UDP glucuronosyltransferases in the gastrointestinal tract. Toxicol. Appl. Pharmacol. 2004;199:354–63. - PubMed
-
- Guillemette C, Levesque E, Harvey M, Bellemare J, Menard V. UGT genomic diversity: beyond gene duplication. Drug Metab. Rev. 2010;42:24–44. - PubMed
-
- Laakkonen L, Finel M. A molecular model of the human UDP-glucuronosyltransferase 1A1, its membrane orientation, and the interactions between different parts of the enzyme. Mol. Pharmacol. 2010;77:931–9. - PubMed
Publication types
MeSH terms
Substances
Grants and funding
LinkOut - more resources
Full Text Sources
Other Literature Sources
