. 2013 Mar 26;7(3):2078-89.
doi: 10.1021/nn3043463. Epub 2013 Mar 12.

Theranostic nanoparticles with controlled release of gemcitabine for targeted therapy and MRI of pancreatic cancer

Affiliations

Theranostic nanoparticles with controlled release of gemcitabine for targeted therapy and MRI of pancreatic cancer

Gee Young Lee et al. ACS Nano. .

Abstract

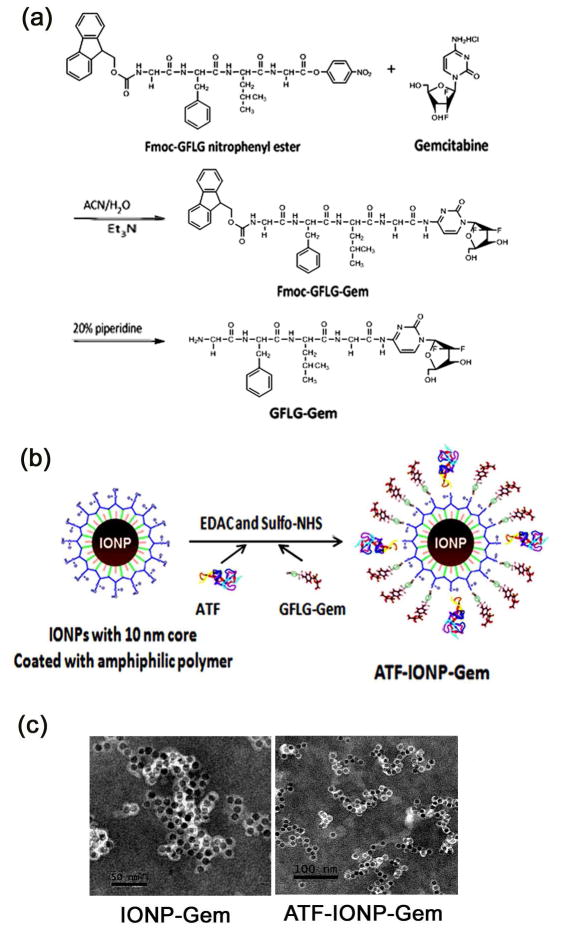
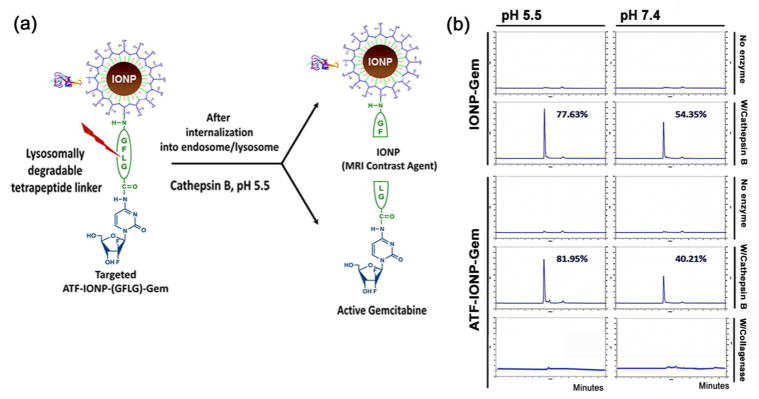
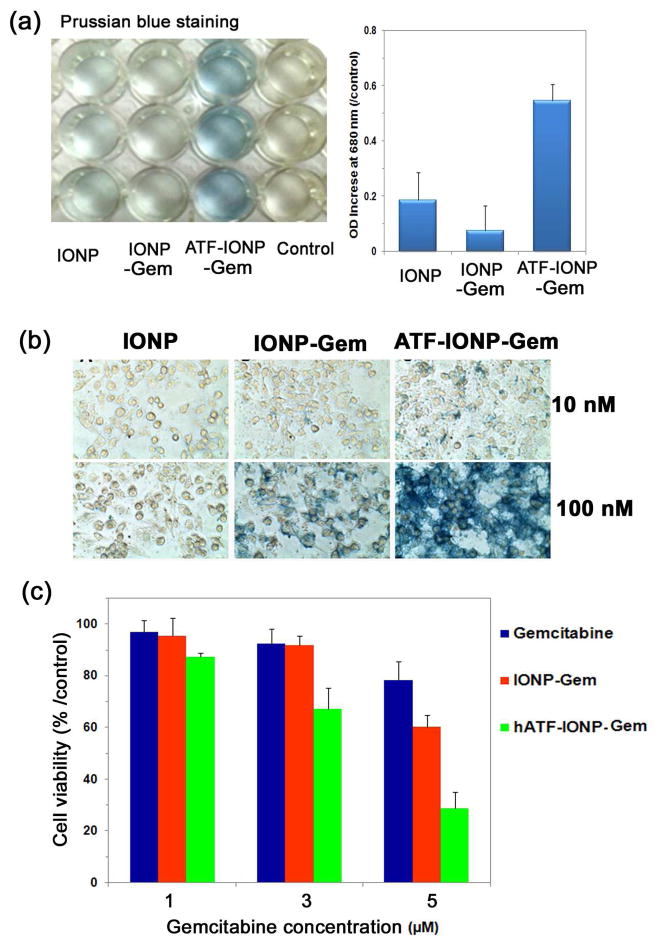
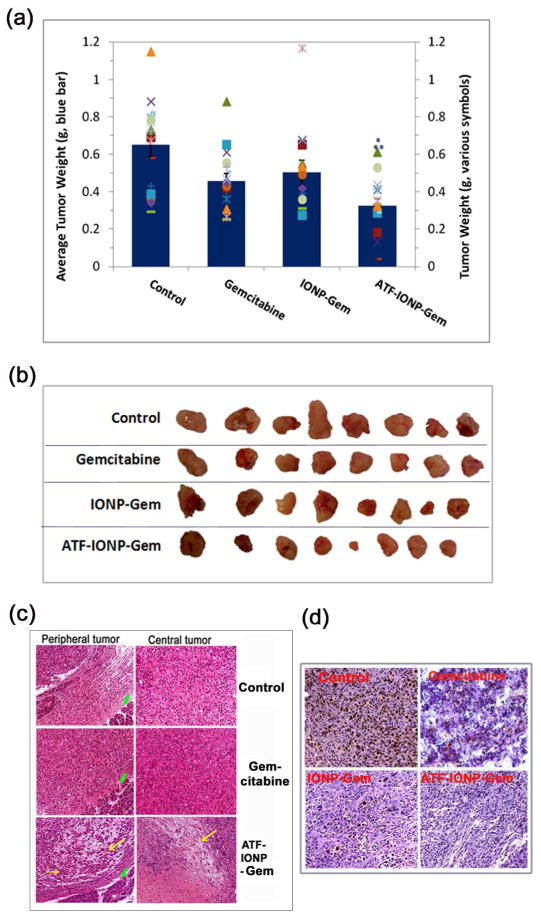
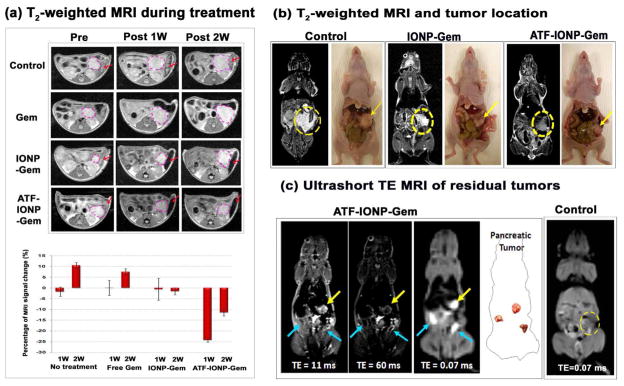
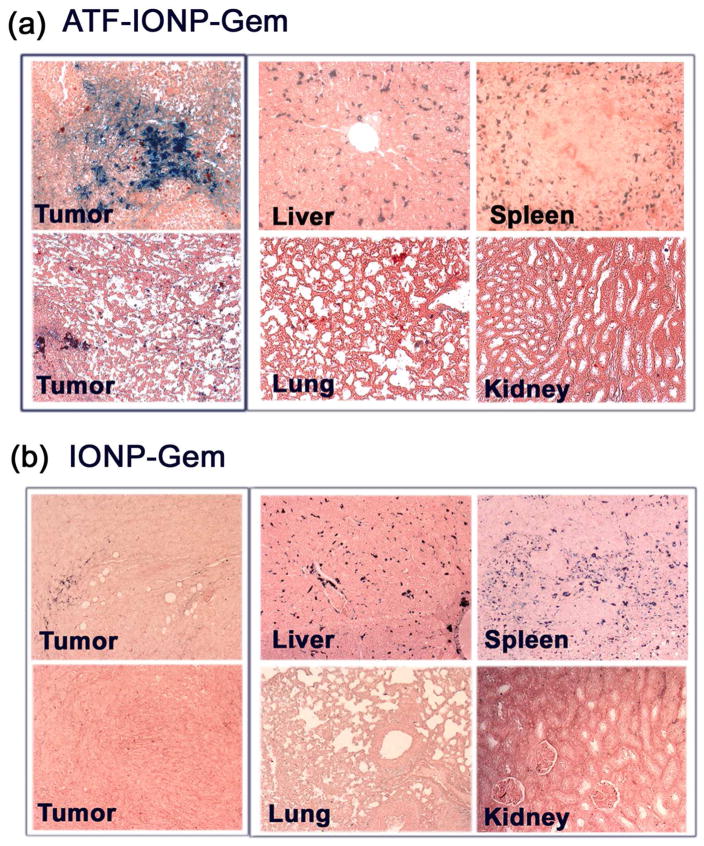
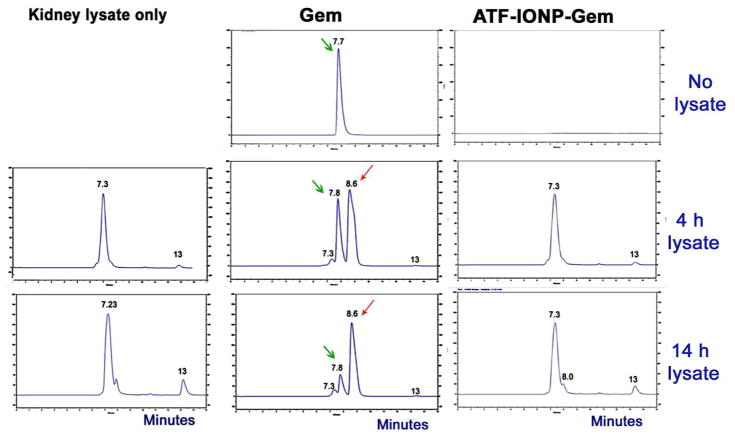
The tumor stroma in human cancers significantly limits the delivery of therapeutic agents into cancer cells. To develop an effective therapeutic approach overcoming the physical barrier of the stroma, we engineered urokinase plasminogen activator receptor (uPAR)-targeted magnetic iron oxide nanoparticles (IONPs) carrying chemotherapy drug gemcitabine (Gem) for targeted delivery into uPAR-expressing tumor and stromal cells. The uPAR-targeted nanoparticle construct, ATF-IONP-Gem, was prepared by conjugating IONPs with the amino-terminal fragment (ATF) peptide of the receptor-binding domain of uPA, a natural ligand of uPAR, and Gem via a lysosomally cleavable tetrapeptide linker. These theranostic nanoparticles enable intracellular release of Gem following receptor-mediated endocytosis of ATF-IONP-Gem into tumor cells and also provide contrast enhancement in magnetic resonance imaging (MRI) of tumors. Our results demonstrated the pH- and lysosomal enzyme-dependent release of gemcitabine, preventing the drug from enzymatic degradation. Systemic administrations of ATF-IONP-Gem significantly inhibited the growth of orthotopic human pancreatic cancer xenografts in nude mice. With MRI contrast enhancement by IONPs, we detected the presence of IONPs in the residual tumors following the treatment, suggesting the possibility of monitoring drug delivery and assessing drug-resistant tumors by MRI. The theranostic ATF-IONP-Gem nanoparticle has great potential for the development of targeted therapeutic and imaging approaches that are capable of overcoming the tumor stromal barrier, thus enhancing the therapeutic effect of nanoparticle drugs on pancreatic cancers.


Figures

Figure 1
Figure 1. Schematic of the preparation of ATF-IONP-Gem
(a) Synthetic scheme of GFLG-Gem conjugates, (b) Diagram of the conjugation of ATF peptides and GFLG-Gem conjugates to IONPs, and (c) Transmission electron microscopy (TEM) images of non-targeted IONP-Gem and targeted ATF-IONP-Gem with negative staining.
Figure 2
Figure 2. Drug release condition and efficiency
(a) Schematic diagram of gemcitabine release from ATF-IONP-Gem, and (b) HPLC chromatograms of the amounts of gemcitabine released from non-targeted IONP-Gem (upper) or uPAR-targeted ATF-IONP-Gem (lower). Both NPs were incubated in the presence of 1 μM of cathepsin B or without enzyme at pH 5.5 (left column) or pH 7.4 (right column) for 24 h. 1 μM of a non-specific collagenase was used as a negative control. The amount of released gemcitabine was measured by HPLC. The percentage of release was calculated from the total amount of conjugated gemcitabine molecules on the nanoparticles.
Figure 3
Figure 3. Target specificity and cytotoxicity of ATF-IONP-Gem in a human pancreatic cancer cell line
(a) Prussian blue staining of MIA PaCa-2 cells after incubation with IONPs, IONP-Gem, and ATF-IONP-Gem at 100 nM for 4 h. IONPs in cells were detected as blue stained cells. Cells were collected and the intensity of Prussian blue staining in cell lysates was quantified as O.D. at 680 nm using a microplate reader. (b) Bright field microscopic images of Prussian blue stained cells observed under 40 × magnifications. (c) Cell proliferation assay after 4 h-treatment followed by 72 h incubation. Crystal violet assay was used to determine viable cells in each well of 96-well tissue culture plates. Data are expressed as the percentage of the untreated control. The values shown are means ± S.D. for quadruple samples. Student’s t-test: at 3 μM Gem concentration, No treatment control vs. ATF-IONP-Gem: p = 0.0002, Gem vs. ATF-IONP-Gem: p = 0.0002, IONP-Gem vs. ATF-IONP-Gem: p = 0.005. In 5 μM Gem treated cells, No treatment control vs. ATF-IONP-Gen: p =1×10⁻⁶, Gem vs. ATF-IONP-Gem: p = 0.0002, IONP-Gem vs. ATF-IONP-Gem: p = 0.0003.
Figure 4
Figure 4. In Vivo antitumor effect in an orthotopic human pancreatic cancer xenograft model
Tumor bearing mice received tail vein injections of 2 mg/kg of the Gem-equivalent dose of various IONPs five times. At the end of the experimental period, tumors were collected and weighed. (a) The mean tumor weights (navy bar) and individual tumor weight distribution of the tumor bearing mice in each group are shown as colored symbols. Values represent mean ± S.D. of 16 mice from three repeat studies. *Statistically significant difference vs. control, ONE-Way ANOVA method: p < 0.0001; Modified t-test: p < 0.0002. **Statistically significant difference. ATF-IONP-Gem vs. Gem and IO-Gem groups, ONE-Way ANOVA method: p < 0.05; Modified t-test: p < 0.05. (b) Representative tumor images of each group after dissection. (c) H&E staining of tumor tissue sections. Yellow arrows: necrotic tumor areas. Green arrows: normal pancreatic acini. (d) Immunohistochemical staining of the cell proliferation marker, Ki-67 in tumor tissue sections. Brown: Ki-67 positive tumor cells. Blue: hematoxylin background staining.
Figure 5
Figure 5. MRI of targeted delivery of ATF-IONP-Gem and tumor response to therapy
(a). Axial T2-weighted MR images of the tumor bearing mice before, one week and two weeks after receiving theranostic nanoparticles. Post treatment images were obtained 48 h following the second (1 week) and fourth (2 weeks) injection. The location and size of the cancer lesions (pink dotted circles) can be seen in the MR images. Red arrows indicate the MRI contrast change in the spleen. The percentage of MRI signal change was obtained using averaged signal of the tumor before the treatment (Pre, 0%) as the baseline. Signal intensity in the muscle was used as the basal level for each image. The bar plot shows the mean and standard deviation of the MRI signal changes (N=3) at three different time points. (b) Coronal T2-weighted MR images and corresponding bright field (BF) images of the tumor-bearing mice after systemic delivery of non-targeted IONP-Gem or ATF-IONP-Gem. Tumor bearing mice without nanoparticle treatment were used as controls. Yellow dotted circles and arrows indicate the location of primary tumor lesions in the MR and BF images, respectively. (c) Comparison of short TE (TE=11 ms) and long TE T2-weighted spin-echo (TE=60 ms) and ultrashort TE (TE=0.07 ms) MR images from a mouse treated with ATF-IONP-Gem. All MR images were taken at 48 h after the last of five administrations of targeted IONP-Gem. The control UTE image is from a tumor bearing mouse not receiving nanoparticles. Yellow arrows indicate the location of primary tumor lesions and blue arrows indicate the secondary tumor lesions due to metastasis.
Figure 6
Figure 6. Biodistribution of (a) ATF-IONP-Gem and (b) non-targeted IONP-Gem following systemic treatments
Tumor and normal tissue sections obtained from mice at the end of the five treatments were stained with Prussian blue staining. Blue: IONP positive cells; Red: Nuclear fast red background staining.
Figure 7
Figure 7. Stability of Gem and ATF-IONP-Gem in mouse kidney tissue lysates
Free Gem and ATF-IONP-Gem were incubated with fresh mouse kidney tissue lysates at 37°C for 4 to 14 h. Filtrates were analyzed by HPLC. HPLC chromatograms show that the kidney lysate has a peak at 7.2 to 7.3 minutes. Gem has a peak at 7.7 to 7.8 minutes (green arrows). Inactivated Gem (dFdU) was found at 8.6 minutes (red arrow). Chromatogram is not shown after 14 minutes.

Similar articles

Cited by

References

    1. Willett CG, Czito BG, Bendell JC, Ryan DP. Locally Advanced Pancreatic Cancer. J Clin Oncol. 2005;23:4538–4544. - PubMed
    1. Warshaw AL, Fernandez-del Castillo C. Pancreatic Carcinoma. N Engl J Med. 1992;326:455–465. - PubMed
    1. Hwang RF, Moore T, Arumugam T, Ramachandran V, Amos KD, Rivera A, Ji B, Evans DB, Logsdon CD. Cancer-Associated Stromal Fibroblasts Promote Pancreatic Tumor Progression. Cancer Res. 2008;68:918–926. - PMC - PubMed
    1. Mahadevan D, Von Hoff DD. Tumor-Stroma Interactions in Pancreatic Ductal Adenocarcinoma. Mol Cancer Ther. 2007;6:1186–1197. - PubMed
    1. Kalluri R, Zeisberg M. Fibroblasts in Cancer. Nat Rev Cancer. 2006;6:392–401. - PubMed

Publication types

MeSH terms