. 2013 May;54(5):1346-59.
doi: 10.1194/jlr.M035063. Epub 2013 Feb 12.

Perilipin-2-null mice are protected against diet-induced obesity, adipose inflammation, and fatty liver disease

Affiliations

Perilipin-2-null mice are protected against diet-induced obesity, adipose inflammation, and fatty liver disease

James L McManaman et al. J Lipid Res. 2013 May.

Abstract

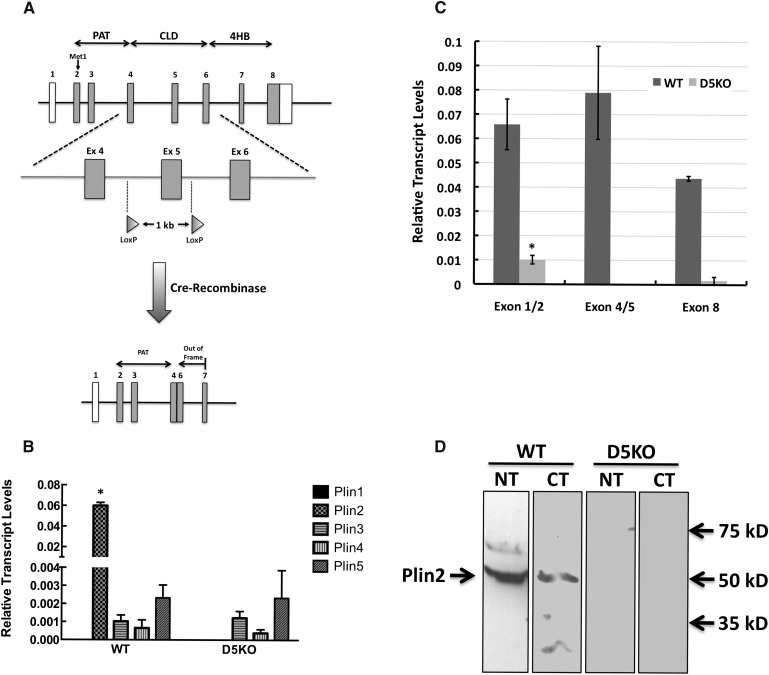
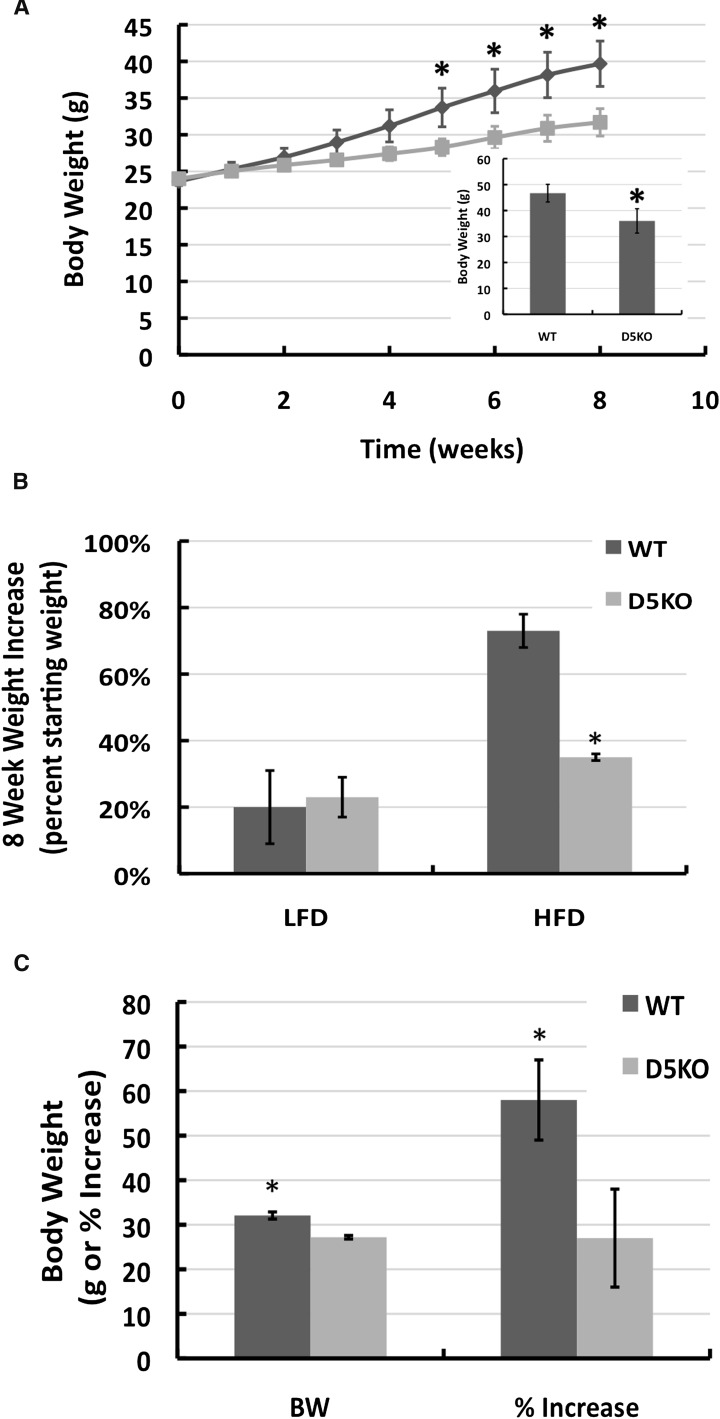
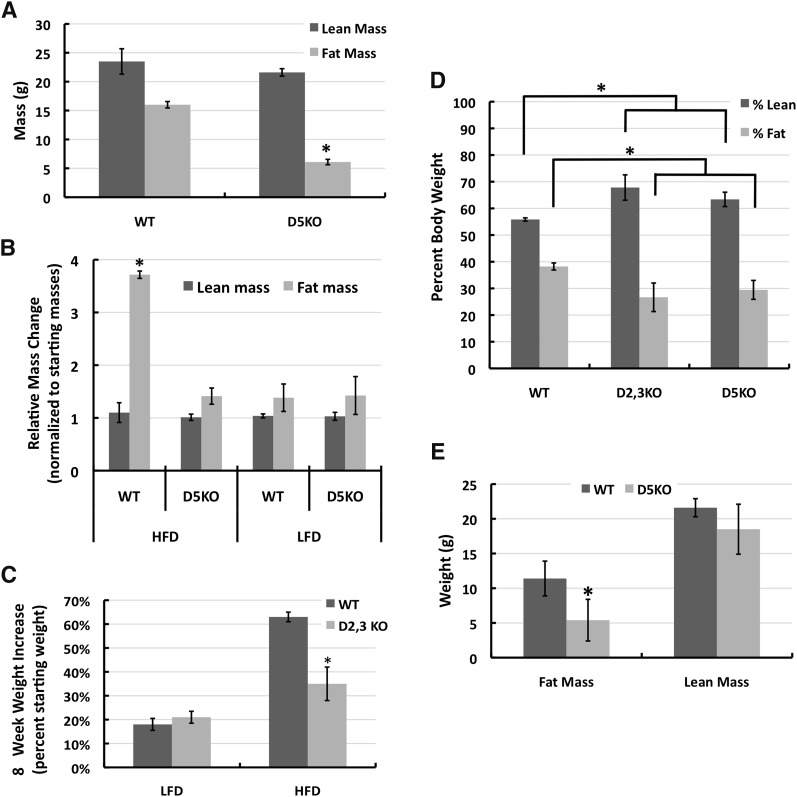
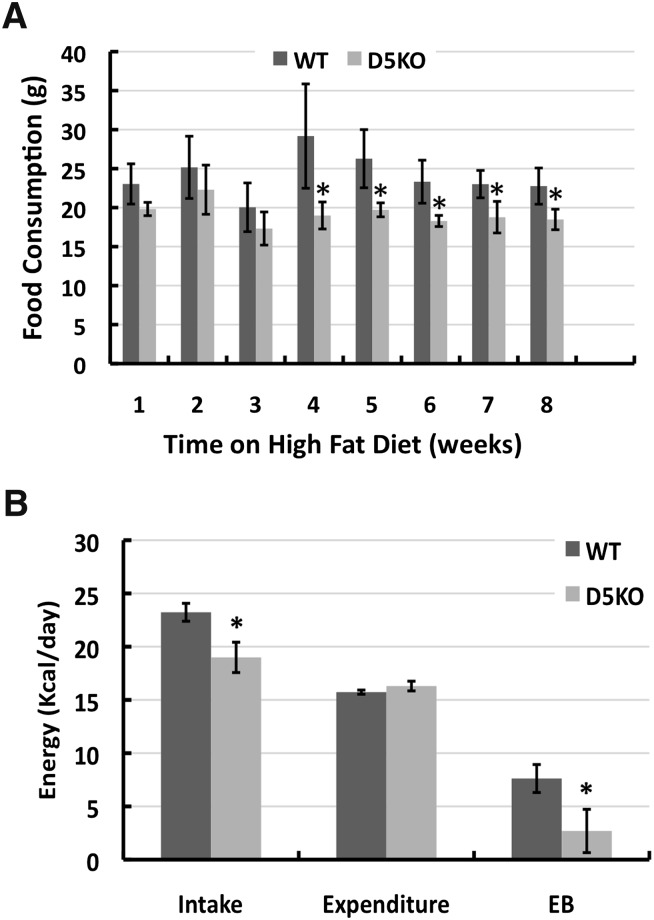
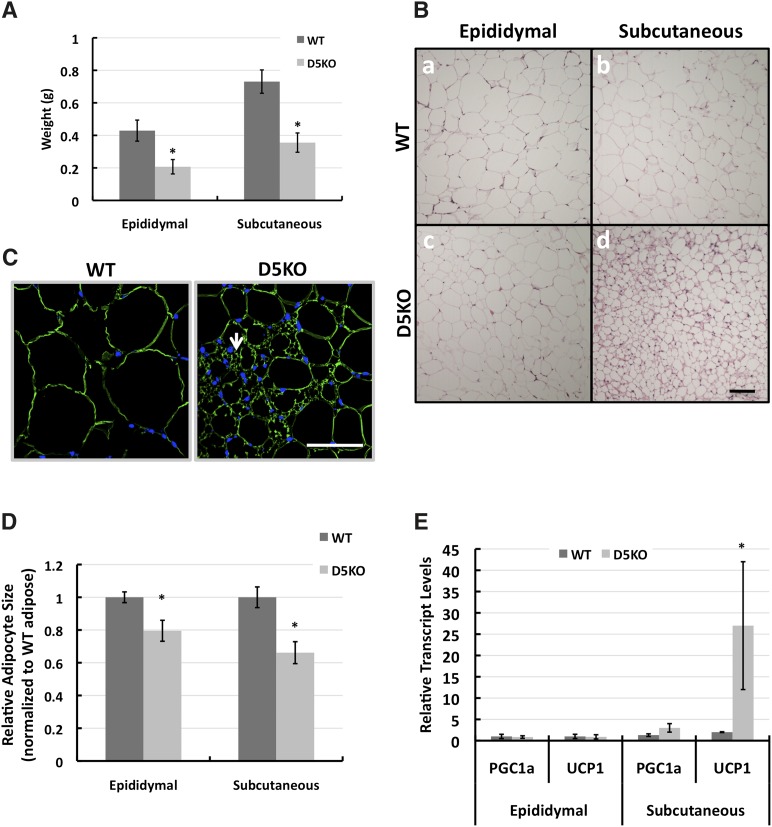
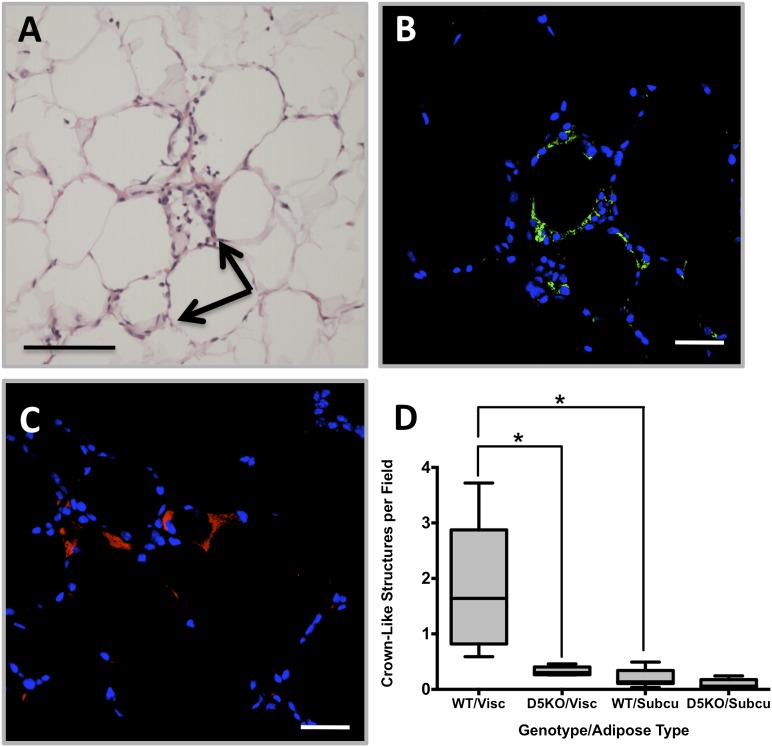
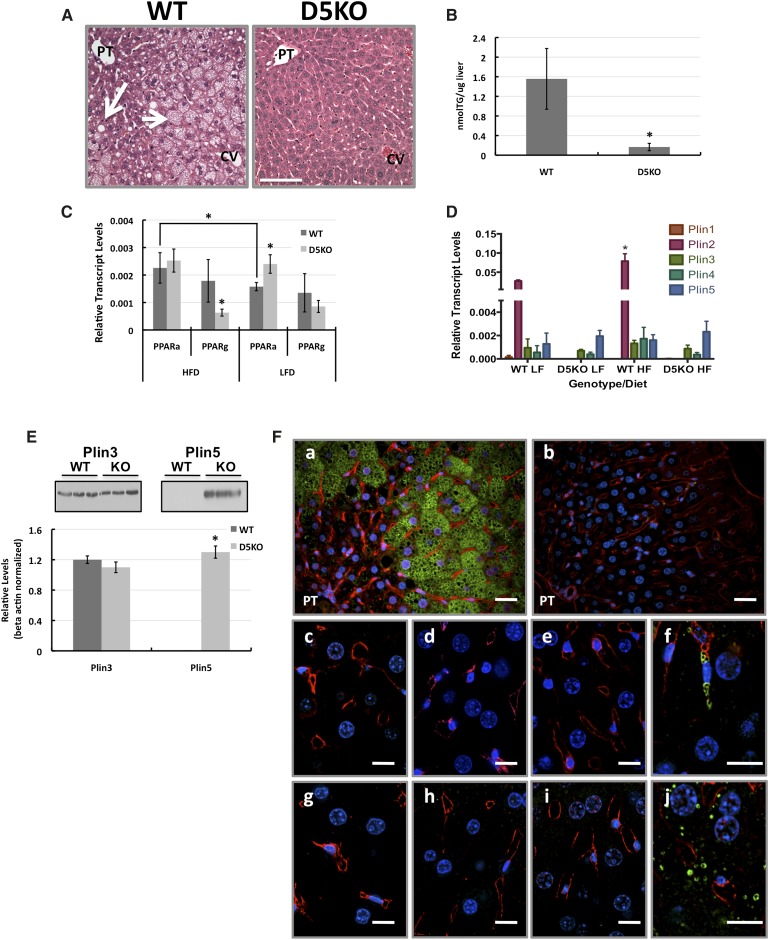
The cytoplasmic lipid droplet (CLD) protein perilipin-2 (Plin2) is expressed in multiple nonadipose tissues, where it is thought to play a role in regulating their lipid storage properties. However, the extent to which Plin2 functions in nutrient utilization and metabolism, or how it influences the consequences of over-feeding, remains unclear. In this study, we demonstrate that the absence of Plin2 prevents high-fat diet(HFD)-induced obesity in male and female mice. This response is associated with increased formation of subcutaneous beige adipocyte cells with uncoupling protein 1 expression, and amelioration of inflammatory foci formation in white adipose tissue and steatosis in the liver. Experiments demonstrate that Plin2 loss results in reduced energy intake and increased physical activity in response to HFD feeding. Our study provides the first evidence that Plin2 contributes to HFD-induced obesity by modulating food intake, and that its absence prevents obesity-associated adipose tissue inflammatory foci and liver steatosis.


Figures

Fig. 1.
Fig. 1.
Generation of Plin2(Δ5) mice. A: Scheme used for disrupting the Plin2 locus. Transgenic mice harboring loxP sites flanking exon 5 of the Plin2 locus were crossed with Cre-recombinase-expressing mice to produce mice in which exons 4 and 6 in the Plin2 locus are fused, generating a frame-shift mutation and a premature stop codon in exon 7. B: Transcript levels of PLIN family members in livers of fasted and refed WT and Plin2(Δ5) mice (referred to as D5KO in all figures). Values are means ± SD normalized to 18S RNA. C: Exon 5 excision does not generate alternate splice forms of Plin2. The relative levels of exon 1–2, exon 4–5, and exon 8 products in fasted and refed livers of WT and Plin2(Δ5) mice were quantified by qRT-PCR and are shown as means ± SD normalized to 18S RNA. D: Plin2 is not detectable in livers of Plin2(Δ5) mice. Representative immunoblots of liver extracts (50 μg) from fasted and refed WT and Plin2(Δ5) mice probed with antibodies to N-terminal (NT)- and C-terminal (CT)-specific sequences of mouse Plin2 (15). Bands corresponding to full-length Plin2 in liver extracts from WT mice and the relative positions of selected molecular weight standards are indicated with arrows. Statistically significant differences are indicated by asterisks
Fig. 2.
Fig. 2.
Plin2 loss prevents HF diet-induced weight gain. A: Weight gain profiles of 8 week-old WT (dark line) and Plin2(Δ5) (light line) male mice fed a HF diet for 8 weeks. (Note that the weight of WT and Plin2(Δ5) animals at 8 weeks of age is virtually identical). Values are average body weights ± SEM of three separate cohorts of WT (N = 15) and Plin2(Δ5) (N = 14) mice. The inset shows the average body weights ± SD for two cohorts of WT (N = 7) and Plin2(Δ5) (N = 8) mice after 12 weeks of HF diet feeding. B: Relative increases in body weights of 8 week-old male WT and Plin2(Δ5) mice fed LF or HF diets for 8 weeks. The values are mean (± SD) percent increase in body weights. WT-HFD (N = 6); WT-LFD (N = 6); Plin2(Δ5)-HFD (N = 6); Plin2(Δ5)-LFD (N = 6). C: Body weights and the percent increase in body weight of 8 week-old female WT and Plin2(Δ5) mice fed the HF diet for 8 weeks. Values are means ± SD of WT (N = 6) and Plin2(Δ5) (N = 6) mice.
Fig. 3.
Fig. 3.
Plin2 loss reduces adiposity in HF diet-fed mice. A: Body compositions determined by magnetic resonance imaging of male WT and Plin2(Δ5) mice fed the HF diet for 8 weeks beginning at 8 weeks of age. The values are means ± SEM of three separate cohorts of WT (N = 15) and Plin2(Δ5) (N = 14) mice. B: Relative effects of LF and HF diets on body composition of WT and Plin2(Δ5) mice. The values are means ± SD of lean and fat mass weights of 8 week-old male WT and Plin2(Δ5) mice fed LF or HF diets for 8 weeks normalized to their starting weights. WT-HF (N = 15); WT-LF (N = 6); Plin2(Δ5)-HF (N = 14); Plin2(Δ5)-LF (N = 6). C: Relative increases in body weights of 8 week-old male WT and Plin2(Δ2,3) mice fed the HF diet for 9 weeks. The values are average percent increase in body weight ± SD over 8 weeks for WT (N = 6) and Plin2(Δ2,3) (N = 6) mice. D: Effects of HF diet feeding on fat and lean mass composition of WT, Plin2(Δ5), and Plin2(Δ2,3). Eight week-old males from each strain were fed the HF diet for 8 weeks. Lean and fat masses are shown as a percentage of body weight. Values are means ± SD for WT (N = 8), Plin2(Δ5) (N = 8), and Plin2(Δ2,3) (N = 6) animals. E: Effects of 8 weeks of HF feeding, beginning at 8 weeks of age, on mean lean and fat mass weights (± SD) of female WT (N = 6) and Plin2(Δ5) (N = 6) mice. Statistically significant differences are indicated by asterisks.
Fig. 4.
Fig. 4.
Plin2 loss reduces food consumption and alters energetic properties. A: Weekly food consumption for male WT and Plin2(Δ5) mice fed the HF diet for 8 weeks. Food consumption values are average weights (g) of food consumed per week (± SD) for WT (N = 8) and Plin2(Δ5) (N = 8) mice. B: Energy intake (Intake), weight-adjusted energy expenditure (Expenditure), and energy balance (EB) values for male WT (N = 4) and Plin2(Δ5) (N = 4) mice on week 8 of HF feeding. The values are mean (± SD) for cohorts of four mice. Statistically significant differences are indicated by asterisks.
Fig. 5.
Fig. 5.
Effects of Plin2 absence on adipose properties. A: Average (± SD) epididymal and subcutaneous adipose weights of male WT (N = 8) and Plin2(Δ5) (N = 8) mice on week 12 of HF feeding. B: Histology of adipocytes in epididymal (a, c) and subcutaneous (b, d) adipose tissue from male WT (a, b) and Plin2(Δ5) (c, d) mice on week 12 of HF feeding. Images show representative H and E-stained sections. C: Plin1 immunostaining of sections of subcutaneous adipose tissue from male WT and Plin2(Δ5) males on week 12 of HF feeding, showing the presence of adipocytes with multilocular droplets (arrow) in Plin2(Δ5) adipocytes. D: Relative adipocyte sizes of male WT and Plin2(Δ5) mice on week 12 of HF feeding. The values are shown relative to the average diameters of WT epididymal tissue and subcutaneous adipocytes (48 μm and 46 μm, respectively). E: Average (± SD) PGC1α and UCP1 transcript levels in epididymal and subcutaneous adipose tissue of WT (N = 4) and Plin2(Δ5) (N = 4) mice fed the HF diet for 9 weeks. Statistically significant differences are indicated by asterisks. Scale bars, 50 μm.
Fig. 6.
Fig. 6.
Plin2 loss reduces inflammatory foci (crown-like structures) in visceral adipose. Representative visceral adipose sections from a male WT mouse fed the HF diet for 12 weeks stained with H and E (A) to identify CLSs, arrows in panel A. B: Immunostaining with F4/80 antibodies (green) documents the presence of macrophages in CLSs. C: Immunostaining with Plin2 antibodies (red) shows lipid droplet accumulation in cells of the CLS. D: Relative quantities (means ± SD) of CLSs in epdidiymal (Visc) and subcutaneous (Subcu) adipose tissue from WT (N = 8) and Plin2(Δ5) mice (N = 8). Statistically significant differences are indicated by asterisks. Scale bars: 50 μm (A), 20 μm (B, C).
Fig. 7.
Fig. 7.
Plin2 loss prevents obesity-associated fatty liver disease. A: Representative H and E-stained liver sections from male WT and Plin2(Δ5) mice fed the HF diet for 12 weeks. Areas of microsteatosis and macrosteatosis in sections from WT livers are indicated by short and long arrows, respectively. Histologically evident steatosis was not detected in livers of Plin2(Δ5) mice. PT, portal triad; CV, central vein. Scale bar, 100 μm. B: Hepatic triglyceride (TG) levels in WT (N = 8) and Plin2(Δ5) (N = 7) mice fed the HF diet for 12 weeks. Values are mean TG/mg liver (± SD). C: Hepatic PPARα (PPARa) and PPARγ (PPARg) transcript levels in WT and Plin2(Δ5) mice fed HF or LF diets for 12 weeks. Values are means (± SD) normalized to 18S RNA. WT-HF (N = 8); WT-LF (N = 6); Plin2(Δ5)-HF (N = 7); Plin2(Δ5)-LF (N = 6). D: Transcript levels for PLIN family members in livers of male WT and Plin2(Δ5) mice fed LF or HF diets for 12 weeks. Values are means (± SD) normalized to 18S RNA. WT-HF (N = 8); WT-LF (N = 6); Plin2(Δ5)-HF (N = 7); Plin2(Δ5)-LF (N = 6). E: Immunoblot analysis of Plins 3 and 5 protein levels in livers of male WT and Plin2(Δ5) fed the HF diet for 12 weeks. The blots in the insets show results from three representative WT and Plin2(Δ5) animals. Average relative levels (± SD) of Plin3 and Plin5 are shown in the graph. F: Immunolocalization of PLIN family members (green staining) in livers of male WT (a, c, d, g, h) and Plin2(Δ5) (b, e, f, i, j) fed the HF diet for 12 weeks. Plin2 (a, b); Plin1 (c, e); Plin3 (d, f); Plin4 (g, i); Plin5 (h, j). Nuclei (blue) are stained with DAPI. PT, portal triad. Statistically significant differences are indicated by asterisks. Scale bars: 20 μm (a, b), 10 μm (c–j).

References

    1. Catenacci V. A., Hill J. O., Wyatt H. R. 2009. The obesity epidemic. Clin. Chest Med. 30: 415–444 - PubMed
    1. Unger R. H., Clark G. O., Scherer P. E., Orci L. 2010. Lipid homeostasis, lipotoxicity and the metabolic syndrome. Biochim. Biophys. Acta. 1801: 209–214 - PubMed
    1. Fabbrini E., Magkos F., Mohammed B. S., Pietka T., Abumrad N. A., Patterson B. W., Okunade A., Klein S. 2009. Intrahepatic fat, not visceral fat, is linked with metabolic complications of obesity. Proc. Natl. Acad. Sci. USA. 106: 15430–15435 - PMC - PubMed
    1. Torres D. M., Harrison S. A. 2012. Nonalcoholic steatohepatitis and noncirrhotic hepatocellular carcinoma: fertile soil. Semin. Liver Dis. 32: 30–38 - PubMed
    1. Wang Y., Ausman L. M., Greenberg A. S., Russell R. M., Wang X. D. 2009. Nonalcoholic steatohepatitis induced by a high-fat diet promotes diethylnitrosamine-initiated early hepatocarcinogenesis in rats. Int. J. Cancer. 124: 540–546 - PMC - PubMed