. 2013 Jun;23(6):966-76.
doi: 10.1101/gr.149096.112. Epub 2013 Feb 12.

Two DNA-encoded strategies for increasing expression with opposing effects on promoter dynamics and transcriptional noise

Affiliations

Two DNA-encoded strategies for increasing expression with opposing effects on promoter dynamics and transcriptional noise

Maya Dadiani et al. Genome Res. 2013 Jun.

Abstract

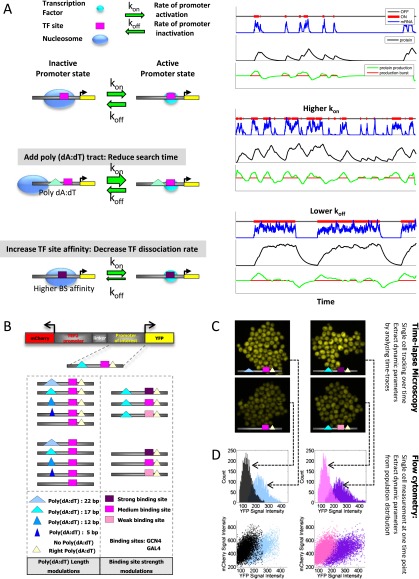
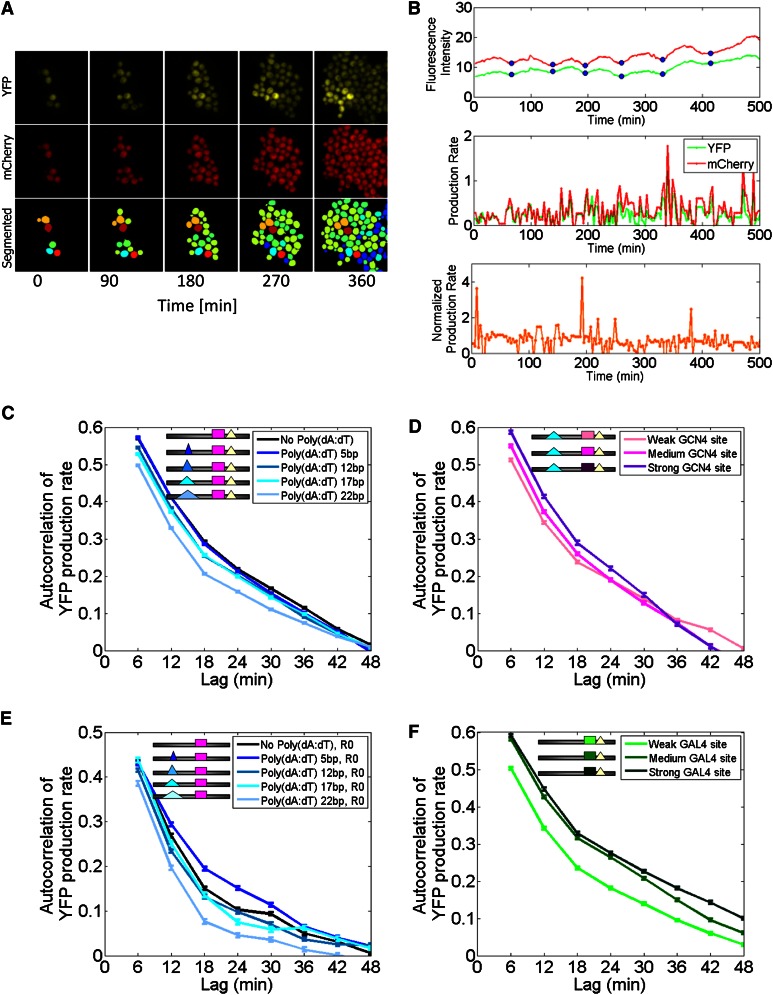
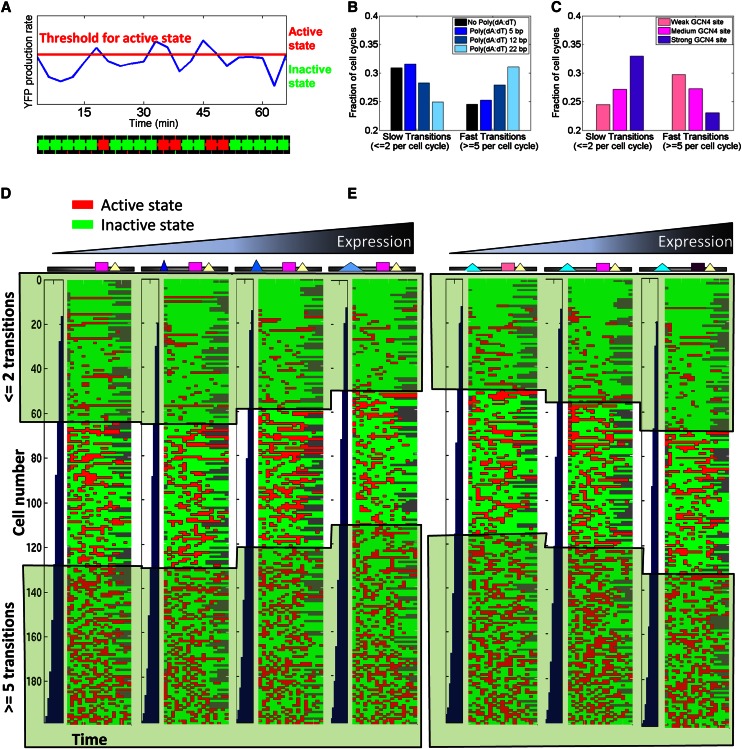
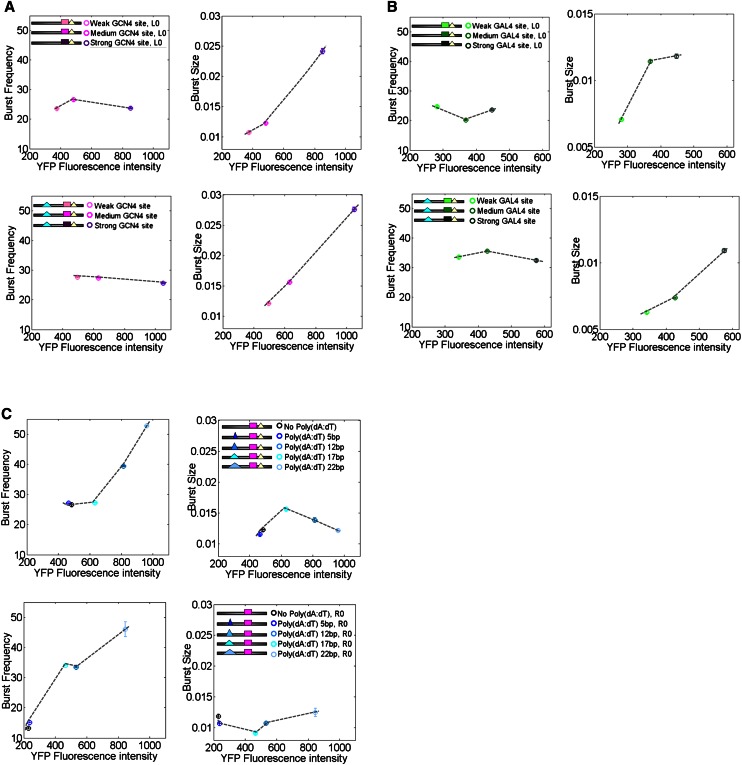
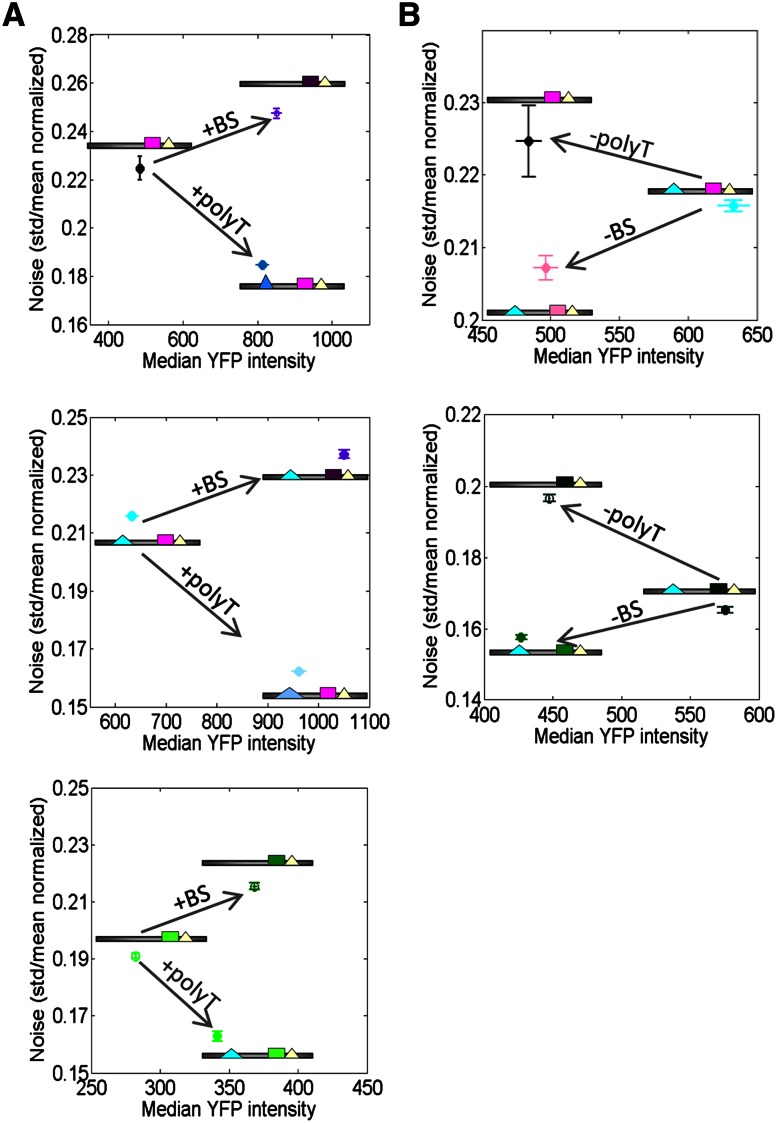
Individual cells from a genetically identical population exhibit substantial variation in gene expression. A significant part of this variation is due to noise in the process of transcription that is intrinsic to each gene, and is determined by factors such as the rate with which the promoter transitions between transcriptionally active and inactive states, and the number of transcripts produced during the active state. However, we have a limited understanding of how the DNA sequence affects such promoter dynamics. Here, we used single-cell time-lapse microscopy to compare the effect on transcriptional dynamics of two distinct types of sequence changes in the promoter that can each increase the mean expression of a cell population by similar amounts but through different mechanisms. We show that increasing expression by strengthening a transcription factor binding site results in slower promoter dynamics and higher noise as compared with increasing expression by adding nucleosome-disfavoring sequences. Our results suggest that when achieving the same mean expression, the strategy of using stronger binding sites results in a larger number of transcripts produced from the active state, whereas the strategy of adding nucleosome-disfavoring sequences results in a higher frequency of promoter transitions between active and inactive states. In the latter strategy, this increased sampling of the active state likely reduces the expression variability of the cell population. Our study thus demonstrates the effect of cis-regulatory elements on expression variability and points to concrete types of sequence changes that may allow partial decoupling of expression level and noise.


Figures

Figure 1.
Figure 1.
Promoter variants and experimental setup. (A) Illustration of hypothesized promoter dynamics induced by two distinct DNA-encoded strategies for increasing expression and a matched stochastic simulation of promoter switching, transcription, and translation (right panel) for each strategy. For a simplified model in which promoters transition at some rate between transcriptionally inactive and active states (top), we hypothesize that addition of nucleosome disfavoring elements such as poly(dA:dT) tracts would increase the accessibility of the transcription factor binding site, thereby reducing the time that a factor molecule spends in search of its site (middle). In contrast, we hypothesize that increasing the affinity of a factor binding site would reduce the factor's dissociation rate. Note that both types of sequence changes result in a higher mean expression over the cell population, but with distinct hypothesized effects on promoter dynamics. Using the Gillespie algorithm, we simulate the kinetic scheme in three scenarios. In the simulation runs, we record, as a function of time, the promoter state (black–red line), mRNA levels (blue line), protein levels (black line), and the protein production rate (green line), which is the derivative of the protein levels with respect to time. In addition, we record protein production bursts (red line), when production is positive. The “normal” promoter (top) represents the reference point for the parameter changes. The fast promoter (middle) has an increased kon to simulate an increase in promoter accessibility [added poly(dA:dT)]. The “slow” promoter (bottom) has a decreased koff (with respect to the normal promoter) to simulate an increase in TF binding site affinity. The three example runs shown illustrate that although both parameters can increase the overall expression level, kon increases the frequency of production bursts, while koff increases the length of the bursts. (B) Illustration of promoter variants used in this study. All promoters are genomically integrated upstream of a yellow fluorescent protein (YFP) reporter and into a region that also contains an mCherry fluorescent protein driven by a constant TEF2 promoter. Promoter variants differ in the presence and length of two poly(dA:dT) tracts and in the affinity of the transcription factor binding site for either the Gcn4 or Gal4 transcriptional activators. (C) Representative YFP time-lapse microscopy images of four promoter variants, imaged in a microfluidic platform that supplies a continuous flow of medium. Each cell was followed over time, and its lineage, YFP, and mCherry signal intensity were extracted (Methods). (D) Single-cell flow cytometry data collected for the corresponding promoter variants from C, shown as a histogram of normalized YFP values (top) and as a scatterplot of YFP (x-axis) against mCherry fluorescence (bottom).
Figure 2.
Figure 2.
Opposing effects on promoter dynamics for lengthening poly(dA:dT) tracts and strengthening transcription factor binding sites. (A) Representative time-lapse microscopy images of one imaging area at five different time points, displaying YFP fluorescence (top), mCherry fluorescence (middle), and automatically segmented cells. (B) Representative time-lapse traces of YFP and mCherry fluorescence of a single cell over time (top), along with YFP and mCherry production rates (middle), and normalized YFP production rates (bottom; normalization done by mCherry; see Methods). Blue circles denote cell cycles. (C) Longer poly(dA:dT) tracts result in faster promoter dynamics. Shown is the average autocorrelation of normalized YFP production rates across thousands of different cell traces for each of five different promoter variants with poly(dA:dT) tracts of length 0, 5, 12, 17, or 22 bp. Bars denote standard error. (D) Higher-affinity binding sites result in lower promoter dynamics. Same as C, for three promoter variants that differ only in the affinity of the Gcn4 site. (E) Same as C, but where the poly(dA:dT) tract variants were inserted into a different genetic background in which the right poly(dA:dT) tract is deleted (R0). (F) Same as D, but for three Gal4 sites that differ in their affinity.
Figure 3.
Figure 3.
Lengthening poly(dA:dT) tracts and strengthening transcription factor binding sites have opposing effects on the rate of promoter transitions between active and inactive states. (A) Illustration of our analysis of promoter transition rates. For each cell cycle of every cell, we classify its trace of normalized YFP production rate (blue trace illustrated here for one cell cycle of one cell) into active (red) and inactive (green) states according to whether they are above or below a predefined arbitrary threshold (red horizontal line), respectively. (B) Increasing the length of a poly(dA:dT) tract results in a higher rate of transitions between active and inactive states. For promoter variants that differ in the length of a poly(dA:dT) tract, shown is the fraction of all of its measured cell cycle traces in which the number of transitions between active and inactive states was at most two (slow transitions; left bar graph) or at least five (fast transitions; right bar graph). The comparison of these different promoter variants was done at a threshold in which the fraction of all inactive states in each variant was 70% (since absolute expression levels vary across variants, the absolute threshold value is different for each variant). See Supplemental Figure S4 for similar analyses at a range of thresholds from 50% to 90%. (C) Increasing the affinity of a transcription factor binding site results in a lower rate of transitions between active and inactive states. Same as B, but for variants that differ in the affinity of a Gcn4 binding site. (D) Visual illustration of cell cycle traces corresponding to the bar graphs from B in which the length of poly(dA:dT) tracts was varied. For each promoter variant, shown are 200 rows that each correspond to a time trace of one cell cycle of one cell with colored entries representing active (red) or inactive (green) states at a threshold in which 70% of all states were inactive. Rows are sorted according to the number of transitions between active and inactive states, and the 200 rows were sampled from all cell cycle traces such that they accurately represent the same probability distribution of the number of transitions across all cell cycle traces. (E) Same as D, but for the bar graphs from C in which the affinity of Gcn4 sites was altered.
Figure 4.
Figure 4.
Flow cytometry validation of opposing effects of lengthening poly(dA:dT) tracts and strengthening transcription factor binding sites. (A) Strengthening the affinity of a transcription factor binding site mainly affects burst size. For two different sets of promoter variants, each with three different binding site affinities for Gcn4, shown are the values of the two parameters from the Gamma function when fitted to the normalized YFP intensities of each promoter variant measured over the cell population at a single time point using a flow cytometer. Under certain assumptions (Friedman et al. 2006; Taniguchi et al. 2010), these two parameters correspond to the burst frequency (left graph) and burst size (right graph). Note the larger variation in burst size across these variants. (B) Same as A, for variants in which the affinities of Gal4 binding sites were varied. (C) Lengthening a poly(dA:dT) tract mainly affects burst frequency. Same as A, for variants in which the length of a poly(dA:dT) tract was varied. In contrast to A and B, note the larger variation in burst frequency across these variants. [R0, right poly(dA:dT) deleted; L0, left poly(dA:dT) deleted.]
Figure 5.
Figure 5.
Adding poly(dA:dT) tracts and strengthening transcription factor binding sites have opposing effects on transcriptional noise. (A) Adding a poly(dA:dT) tract results in a similar increase in mean expression level but in lower noise compared with strengthening the affinity of a transcription factor binding site. For three sets of promoter variants (three different graphs), shown are the median YFP expression (x-axis) and expression noise (standard deviation of expression divided by the mean expression) of a starting promoter (leftmost promoter in each graph with lowest median YFP expression) and two promoters representing modifications to the starting promoter, in which either a poly(dA:dT) tract was added (bottom right promoter in each plot) or the binding site was strengthened (top right promoter in each plot). Note that both promoter modifications result in similar mean expression levels, but the promoter in which the poly(dA:dT) tract was added always has lower noise. Bars denote standard error. (B) Same as A, but where the starting promoter contained a poly(dA:dT) tract and a strong transcription factor binding site, and the modifications either deleted the poly(dA:dT) tract (top left promoter in each plot) or weakened the binding site (bottom left promoter in each plot). As in A, both promoter modifications result in similar mean expression levels, but the promoter with the poly(dA:dT) tract always has lower noise.

References

    1. Bai L, Charvin G, Siggia ED, Cross FR 2010. Nucleosome-depleted regions in cell-cycle-regulated promoters ensure reliable gene expression in every cell cycle. Dev Cell 18: 544–555 - PMC - PubMed
    1. Bar-Even A, Paulsson J, Maheshri N, Carmi M, O'Shea E, Pilpel Y, Barkai N 2006. Noise in protein expression scales with natural protein abundance. Nat Genet 38: 636–643 - PubMed
    1. Blake WJ, Kaern M, Cantor CR, Collins JJ 2003. Noise in eukaryotic gene expression. Nature 422: 633–637 - PubMed
    1. Blake WJ, Kohanski MA, Isaacs FJ, Murphy KF, Kuang Y, Cantor CR, Walt DR, Collins JJ 2006. Phenotypic consequences of promoter-mediated transcriptional noise. Mol Cell 24: 853–865 - PubMed
    1. Cai L, Friedman N, Xie XS 2006. Stochastic protein expression in individual cells at the single molecule level. Nature 440: 358–362 - PubMed

Publication types

LinkOut - more resources