

Further improvement in reducing superficial contamination in NIRS using double short separation measurements
- PMID: 23403181
- PMCID: PMC3665655
- DOI: 10.1016/j.neuroimage.2013.01.073
Further improvement in reducing superficial contamination in NIRS using double short separation measurements
Abstract
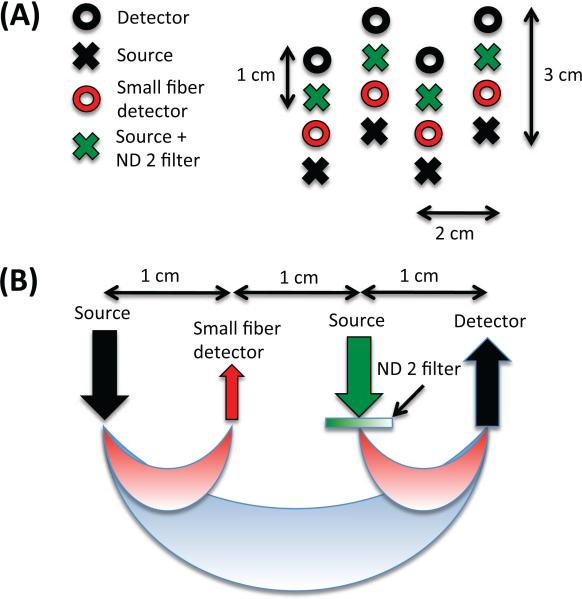
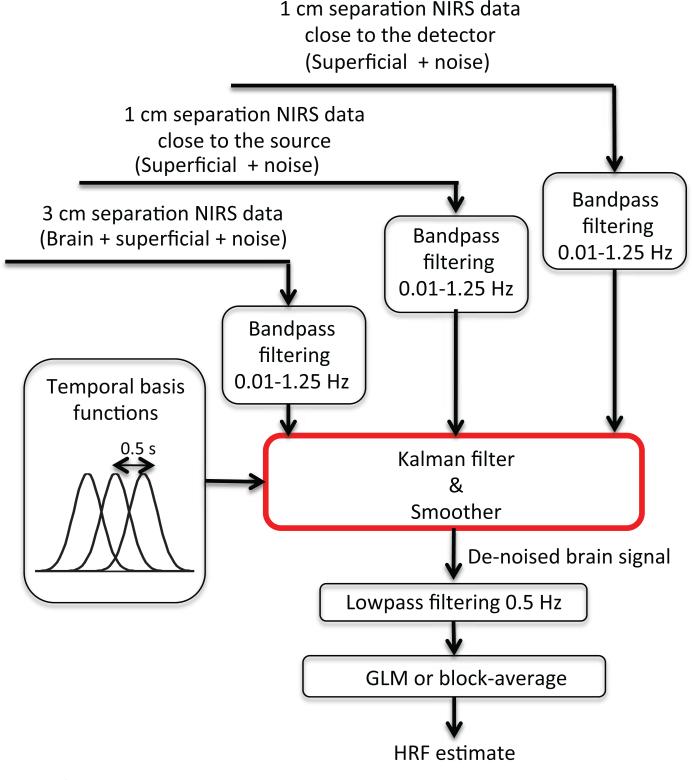
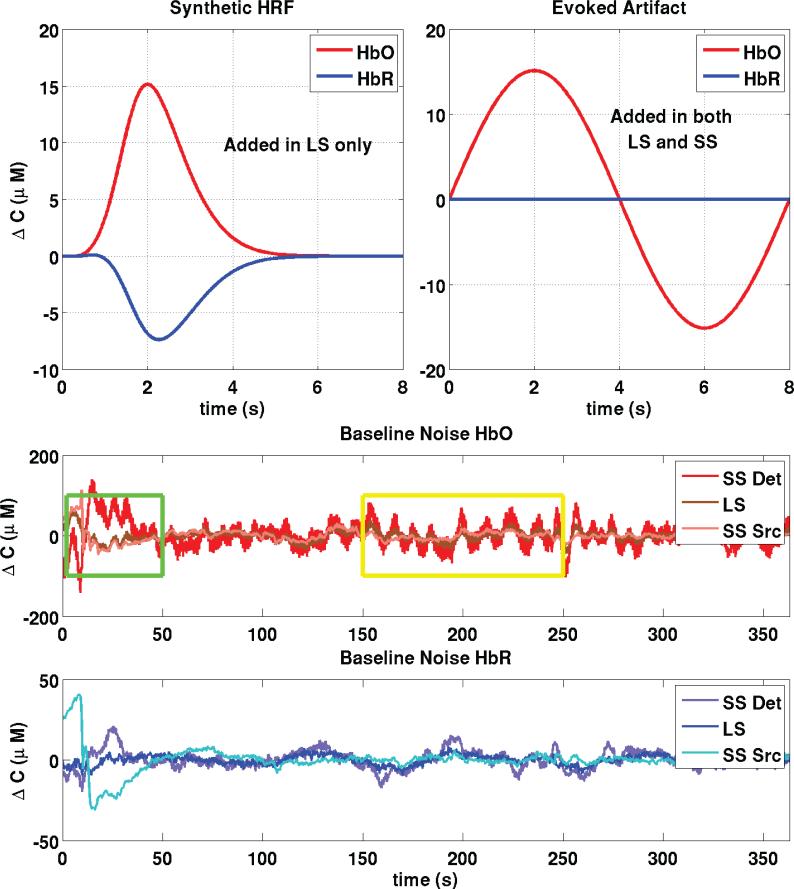
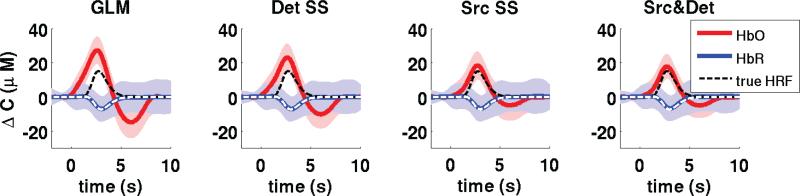
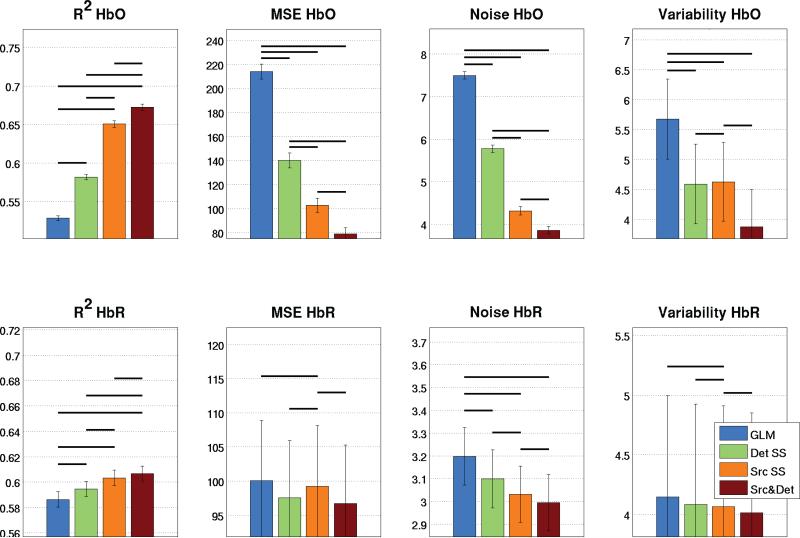
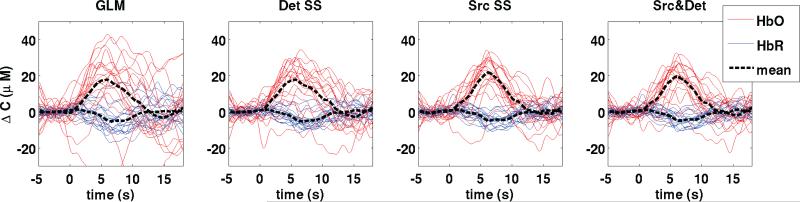
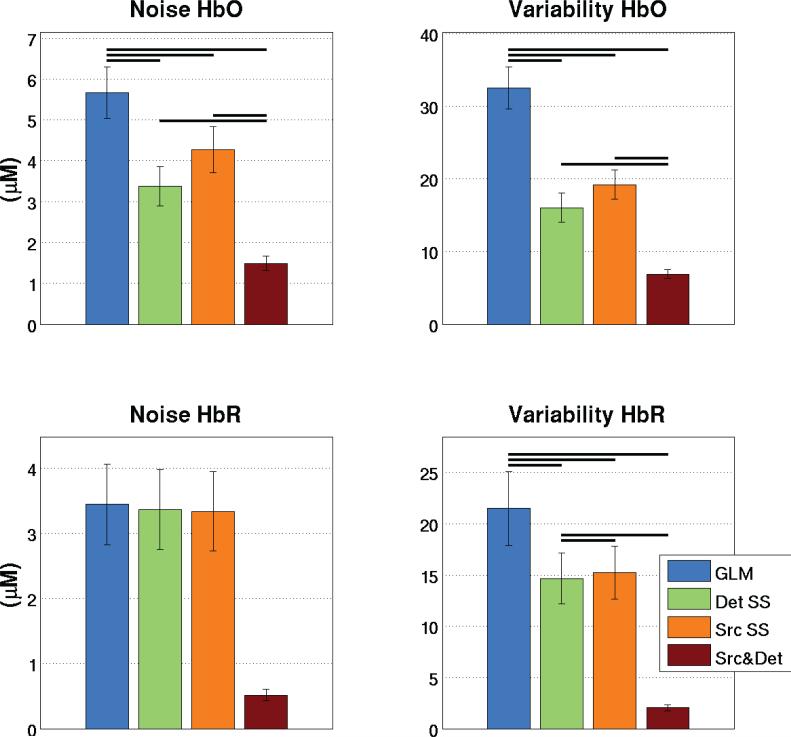
Near-Infrared Spectroscopy (NIRS) allows the recovery of the evoked hemodynamic response to brain activation. In adult human populations, the NIRS signal is strongly contaminated by systemic interference occurring in the superficial layers of the head. An approach to overcome this difficulty is to use additional NIRS measurements with short optode separations to measure the systemic hemodynamic fluctuations occurring in the superficial layers. These measurements can then be used as regressors in the post-experiment analysis to remove the systemic contamination and isolate the brain signal. In our previous work, we showed that the systemic interference measured in NIRS is heterogeneous across the surface of the scalp. As a consequence, the short separation measurement used in the regression procedure must be located close to the standard NIRS channel from which the evoked hemodynamic response of the brain is to be recovered. Here, we demonstrate that using two short separation measurements, one at the source optode and one at the detector optode, further increases the performance of the short separation regression method compared to using a single short separation measurement. While a single short separation channel produces an average reduction in noise of 33% for HbO, using a short separation channel at both source and detector reduces noise by 59% compared to the standard method using a general linear model (GLM) without short separation. For HbR, noise reduction of 3% is achieved using a single short separation and this number goes to 47% when two short separations are used. Our work emphasizes the importance of integrating short separation measurements both at the source and at the detector optode of the standard channels from which the hemodynamic response is to be recovered. While the implementation of short separation sources presents some difficulties experimentally, the improvement in noise reduction is significant enough to justify the practical challenges.
Keywords: Kalman filtering; Near-Infrared Spectroscopy; Short optode separations; State-space analysis; Systemic interference.
Copyright © 2013 Elsevier Inc. All rights reserved.
Figures
Similar articles
-
Short separation channel location impacts the performance of short channel regression in NIRS.Neuroimage. 2012 Feb 1;59(3):2518-28. doi: 10.1016/j.neuroimage.2011.08.095. Epub 2011 Sep 8. Neuroimage. 2012. PMID: 21945793 Free PMC article.
-
Improved recovery of the hemodynamic response in diffuse optical imaging using short optode separations and state-space modeling.Neuroimage. 2011 Jun 1;56(3):1362-71. doi: 10.1016/j.neuroimage.2011.03.001. Epub 2011 Mar 6. Neuroimage. 2011. PMID: 21385616 Free PMC article.
-
Quantitative evaluation of deep and shallow tissue layers' contribution to fNIRS signal using multi-distance optodes and independent component analysis.Neuroimage. 2014 Jan 15;85 Pt 1:150-65. doi: 10.1016/j.neuroimage.2013.02.026. Epub 2013 Feb 22. Neuroimage. 2014. PMID: 23439443
-
Time domain functional NIRS imaging for human brain mapping.Neuroimage. 2014 Jan 15;85 Pt 1:28-50. doi: 10.1016/j.neuroimage.2013.05.106. Epub 2013 Jun 5. Neuroimage. 2014. PMID: 23747285 Review.
-
HomER: a review of time-series analysis methods for near-infrared spectroscopy of the brain.Appl Opt. 2009 Apr 1;48(10):D280-98. doi: 10.1364/ao.48.00d280. Appl Opt. 2009. PMID: 19340120 Free PMC article. Review.
Cited by
-
Correction of motion artifacts and serial correlations for real-time functional near-infrared spectroscopy.Neurophotonics. 2016 Jul;3(3):031410. doi: 10.1117/1.NPh.3.3.031410. Epub 2016 May 23. Neurophotonics. 2016. PMID: 27226974 Free PMC article.
-
Assessment of dynamic cerebral autoregulation in near-infrared spectroscopy using short channels: A feasibility study in acute ischemic stroke patients.Front Neurol. 2022 Nov 21;13:1028864. doi: 10.3389/fneur.2022.1028864. eCollection 2022. Front Neurol. 2022. PMID: 36479048 Free PMC article.
-
Feedforward- and motor effort-dependent increase in prefrontal oxygenation during voluntary one-armed cranking.J Physiol. 2018 Nov;596(21):5099-5118. doi: 10.1113/JP276956. Epub 2018 Sep 30. J Physiol. 2018. PMID: 30175404 Free PMC article.
-
Effects of Systemic Physiology on Mapping Resting-State Networks Using Functional Near-Infrared Spectroscopy.Front Neurosci. 2022 Mar 8;16:803297. doi: 10.3389/fnins.2022.803297. eCollection 2022. Front Neurosci. 2022. PMID: 35350556 Free PMC article.
-
Perspective: Prospects of non-invasive sensing of the human brain with diffuse optical imaging.APL Photonics. 2018 Nov;3(11):110901. doi: 10.1063/1.5038571. Epub 2018 Nov 16. APL Photonics. 2018. PMID: 31187064 Free PMC article.
References
-
- Boas D, Dale AM, Franceschini MA. Diffuse optical imaging of brain activation: Approaches to optimizing image sensitivity, resolution and accuracy. NeuroImage. 2004;23:S275–S288. - PubMed
-
- Brainard DH. The psychophysics toolbox. Spatial Vision. 1997;10:433–436. - PubMed
-
- Buchheim K, Obrig H, Pannwitz W, Muller A, Heekeren H, Villringer A, Meierkord H. Decrease in haemoglobin oxygenation during absence seizures in adult humans. Neuroscience Letters. 2004;354:119–122. - PubMed
-
- Deply DT, Cope M, van der Zee P, Arridge S, Wray S, Wyatt J. Estimation of optical pathlength through tissue from direct time of flight measurement. Phys. Med. Biol. 1988;33:1433–1442. - PubMed
Publication types
MeSH terms
Substances
Grants and funding
LinkOut - more resources
Full Text Sources
Other Literature Sources
Research Materials
