. 2013 Feb 21;3(2):342-9.
doi: 10.1016/j.celrep.2013.01.010. Epub 2013 Feb 9.

Endogenous purification reveals GREB1 as a key estrogen receptor regulatory factor

Affiliations

Endogenous purification reveals GREB1 as a key estrogen receptor regulatory factor

Hisham Mohammed et al. Cell Rep. .

Abstract

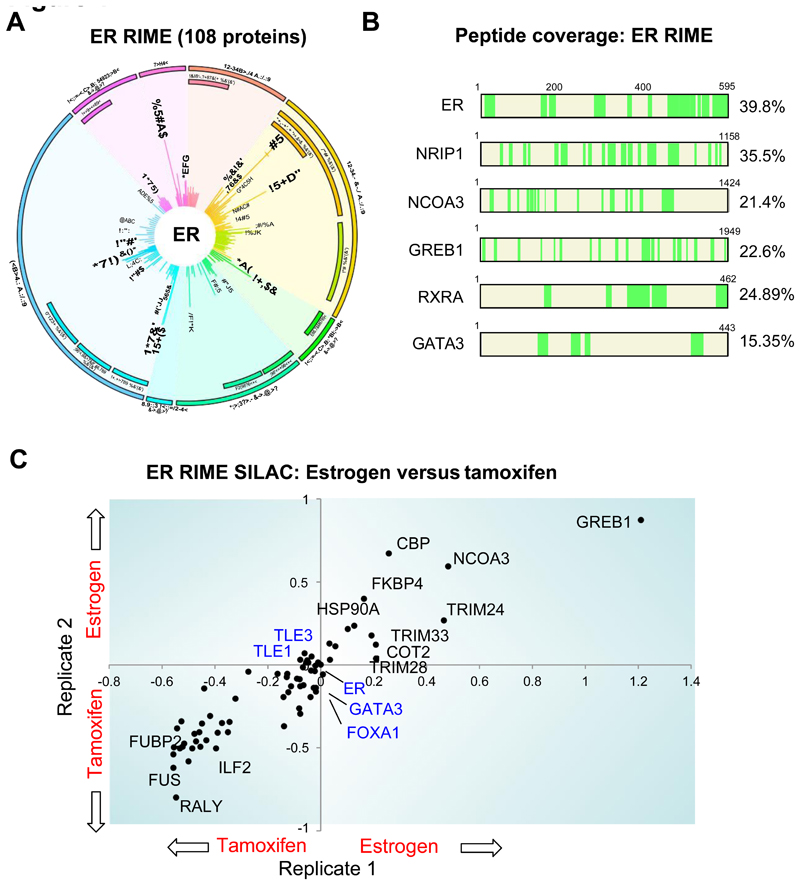
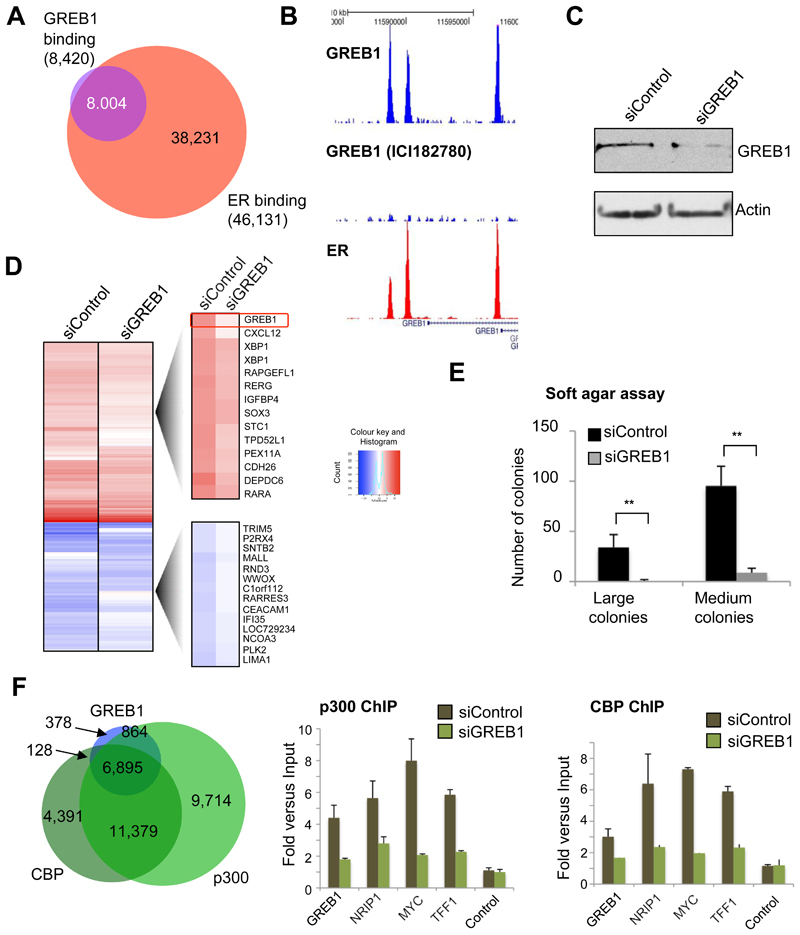
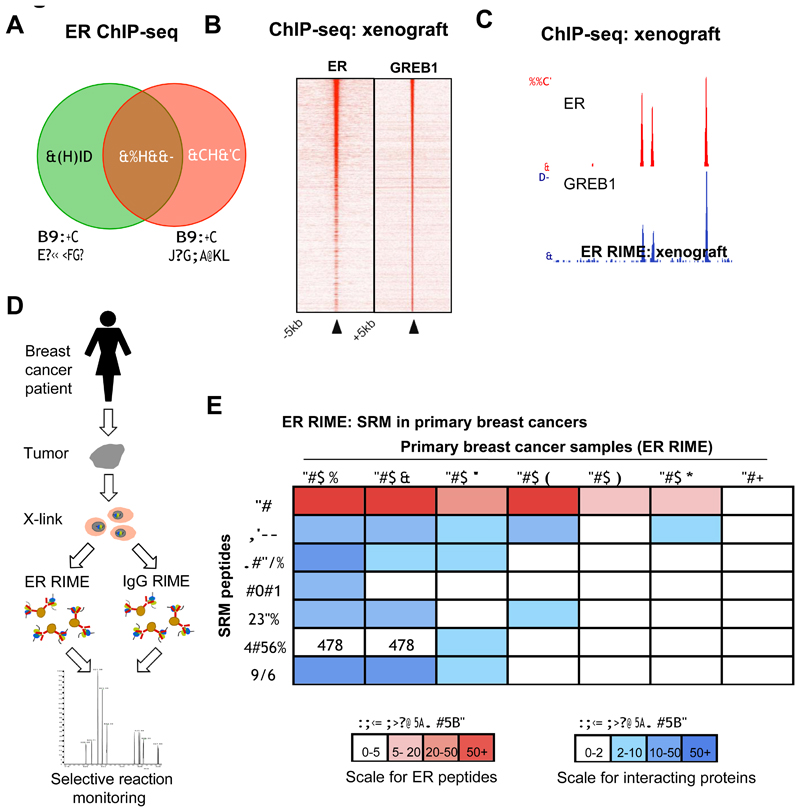
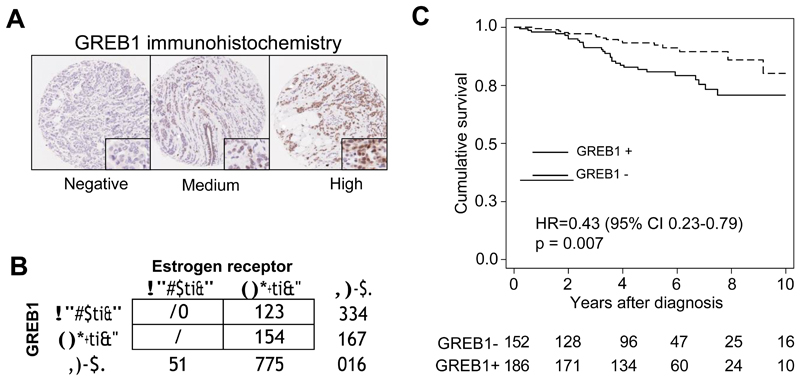
Estrogen receptor-α (ER) is the driving transcription factor in most breast cancers, and its associated proteins can influence drug response, but direct methods for identifying interacting proteins have been limited. We purified endogenous ER using an approach termed RIME (rapid immunoprecipitation mass spectrometry of endogenous proteins) and discovered the interactome under agonist- and antagonist-liganded conditions in breast cancer cells, revealing transcriptional networks in breast cancer. The most estrogen-enriched ER interactor is GREB1, a potential clinical biomarker with no known function. GREB1 is shown to be a chromatin-bound ER coactivator and is essential for ER-mediated transcription, because it stabilizes interactions between ER and additional cofactors. We show a GREB1-ER interaction in three xenograft tumors, and using a directed protein-protein approach, we find GREB1-ER interactions in half of ER(+) primary breast cancers. This finding is supported by histological expression of GREB1, which shows that GREB1 is expressed in half of ER(+) cancers, and predicts good clinical outcome. These findings reveal an unexpected role for GREB1 as an estrogen-specific ER cofactor that is expressed in drug-sensitive contexts.


Conflict of interest statement

Conflict of interest

None of the authors have any conflicts of interest.

Figures

Figure 1
Figure 1
ER RIME (Rapid Immunoprecipitation-Mass Spectrometry of Endogenous protein) was conducted in MCF-7 breast cancer cells. The graphical plot (termed MS-ARC) shows ER associated proteins. Non-specific interactions (identified from multiple IgG control replicates) have been removed. The ER associated proteins are clustered according to molecular function and the length of the line represents the mascot score. B. Peptide coverage (highlighted in green) of ER and additional identified interacting proteins. C. Hormone deprived MCF-7 cells were labeled with ‘heavy’ or ‘light’ SILAC isotopes, treated with estrogen or tamoxifen and ER RIME was conducted. Two replicates were conducted and shown are peptides found in both replicates. The axis represents log10 scale. The ER-DNA interacting complex, including putative pioneer factors are highlighted in blue text. GREB1 was the most estrogen-induced ER interacting protein based on SILAC ratio.
Figure 2
Figure 2
GREB1 is an estrogen-mediated ER interacting protein required for ER function. A. Venn diagram showing overlap of GREB1 binding events and ER binding events, as determined by ChIP-seq. Almost all GREB1 binding events are shared with ER. B. ER ChIP-seq was conducted in asynchronous MCF-7 cells. GREB1 ChIP-seq was conducted in asynchronous cells treated with control or ICI 182780 (an ER down-regulator). An example of a binding region is shown. C. MCF-7 cells were transfected with siControl or siGREB1 and Western blotting confirmed effective knock-down of GREB1. D. Hormone deprived MCF-7 cells were transfected with siControl or siGREB1 (4 replicates) and treated with vehicle or estrogen for 6 hr. Microarray analysis was conducted and estrogen-mediated differential gene changes (in siControl conditions) were determined. The heatmap represents all genes selected as differentially expressed following estrogen treatment relative to vehicle, in either siControl or siGREB1 transfected cells. E. MCF-7 cells were transfected with siControl or siGREB1 and soft agar assays were conducted. ** denotes p < 0.001 and was determined using student t-test. F. Overlap of GREB1 binding with the co-activators p300 and CBP. MCF-7 cells were transfected with siControl or siGREB1 and p300 or CBP ChIP was performed followed by real time PCR of known ER regulatory regions. In the absence of GREB1, p300 and CBP co-activators cannot bind to enhancer elements.
Figure 3
Figure 3
ER and GREB1 interactions in solid tumors. A. MCF7 cells were implanted into a immunocompromised mice and the xenografts were removed for ER and GREB1 ChIP-seq. Overlap in ER binding, as determined by ChIP-seq from the MCF7 cell line grown in vitro and as a xenograft. The growth of MCF7 cells as xenografts results in altered ER binding, when compared to MCF7 cells grown in vitro. B. Heatmap showing binding signal intensity of ER and GREB1 from a xenograft. C. Example of common ER and GREB1 binding events in a MCF7 xenograft. D. Establishment of RIME in clinical samples. Schematic representation of the ER RIME-SRM protocol used for assessing protein interactions in clinical samples. Frozen intact breast tumors were cross-linked and nuclei were collected. Each sample was split into an ER RIME or IgG RIME and subjected to selective reaction monitoring (SRM) to quantify specific peptides representing proteins of interest. E. ER interactions from six ER positive (ER+) and one ER negative (ER-) tumor. Each tumor was split and ER RIME or IgG RIME was conducted. Selective reaction monitoring (SRM) was used to identify the presence of specific peptides that were quantified relative to matched IgG control RIME. Where multiple peptides for a protein were identified, the average was taken. The peptide information can be found in Supplementary figure 8. All enrichments are shown relative to the matched IgG control. N/D = not determined.
Figure 4
Figure 4
A. Example of GREB1 immunohistochemistry. B. Table representing the number of ER or GREB1 expressing breast cancers. C. Kaplan Meier curve representing clinical outcome relative to GREB1 expression in 338 ER+ cases (HR estimate from multivariate analysis). An Allred score of 2 was used as a cut point for GREB1 expression.

References

    1. Ali S, Coombes RC. Endocrine-responsive breast cancer and strategies for combating resistance. Nature reviews. 2002;2:101–112. - PubMed
    1. Anzick SL, Kononen J, Walker RL, Azorsa DO, Tanner MM, Guan XY, Sauter G, Kallioniemi OP, Trent JM, Meltzer PS. Science. Vol. 277. New York, NY: 1997. AIB1, a steroid receptor coactivator amplified in breast and ovarian cancer; pp. 965–968. - PubMed
    1. Carroll JS, Liu XS, Brodsky AS, Li W, Meyer CA, Szary AJ, Eeckhoute J, Shao W, Hestermann EV, Geistlinger TR, et al. Chromosome-wide mapping of estrogen receptor binding reveals long-range regulation requiring the forkhead protein FoxA1. Cell. 2005;122:33–43. - PubMed
    1. Dunbier AK, Anderson H, Ghazoui Z, Folkerd EJ, AHern R, Crowder RJ, Hoog J, Smith IE, Osin P, Nerurkar A, et al. Relationship between plasma estradiol levels and estrogen-responsive gene expression in estrogen receptor-positive breast cancer in postmenopausal women. J Clin Oncol. 2010;28:1161–1167. - PMC - PubMed
    1. Ghosh MG, Thompson DA, Weigel RJ. PDZK1 and GREB1 are estrogen-regulated genes expressed in hormone-responsive breast cancer. Cancer research. 2000;60:6367–6375. - PubMed

Publication types

MeSH terms

Associated data