

Relationship of plasma neuropeptide Y with angiographic, electrocardiographic and coronary physiology indices of reperfusion during ST elevation myocardial infarction
- PMID: 23403409
- PMCID: PMC4976801
- DOI: 10.1136/heartjnl-2012-303443
Relationship of plasma neuropeptide Y with angiographic, electrocardiographic and coronary physiology indices of reperfusion during ST elevation myocardial infarction
Abstract
Objectives: The co-transmitter neuropeptide Y (NPY) is released during high levels of sympathetic stimulation and is a potent vasoconstrictor. We defined the release profile of plasma NPY during acute ST elevation myocardial infarction, and tested the hypothesis that levels correlate with reperfusion measures after treatment with primary percutaneous coronary intervention (PPCI).
Design: Prospective observational study.
Setting: University hospital heart centre.
Patients: 64 patients (62.6±11.7 years-old, 73% male) presenting throughout the 24-h cycle of clinical activity with ST elevation myocardial infarction.
Interventions: PPCI.
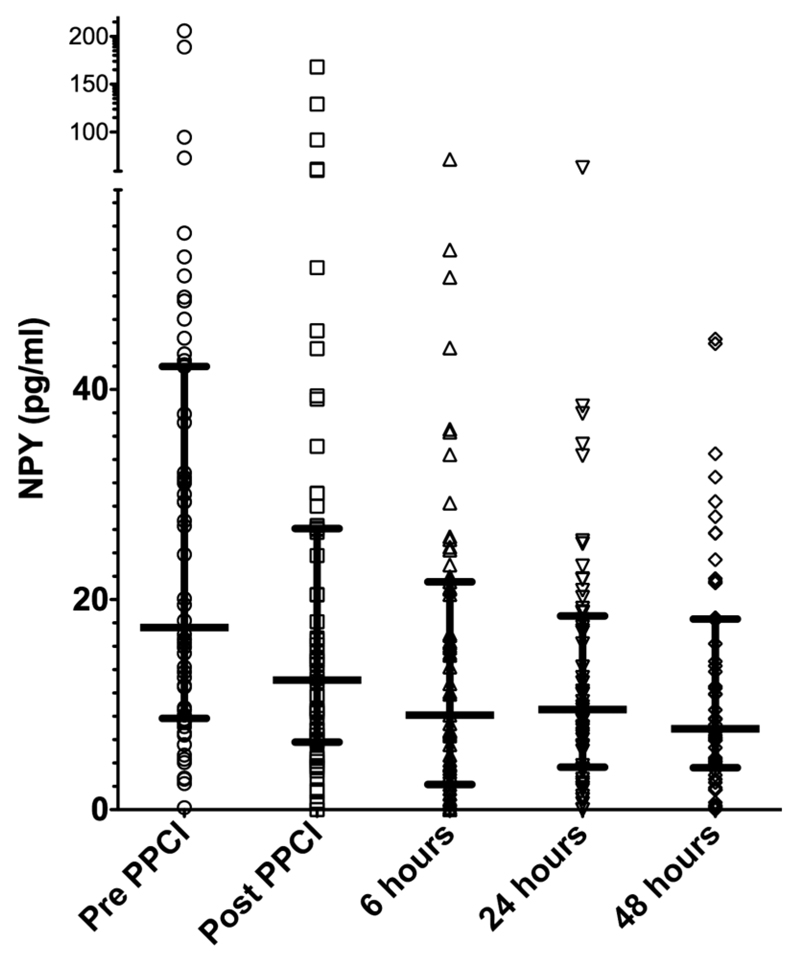
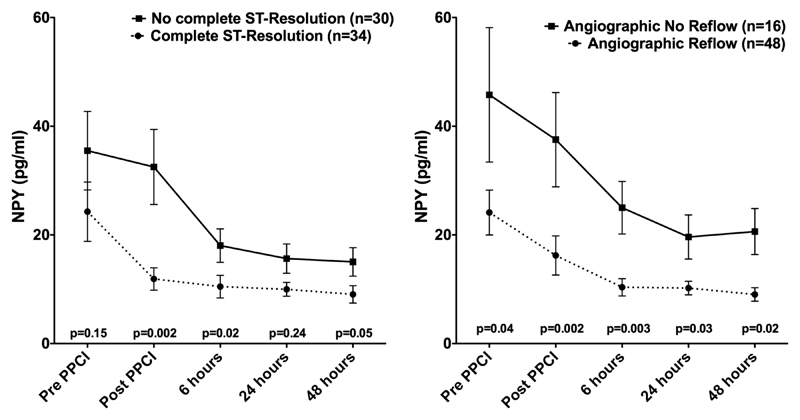
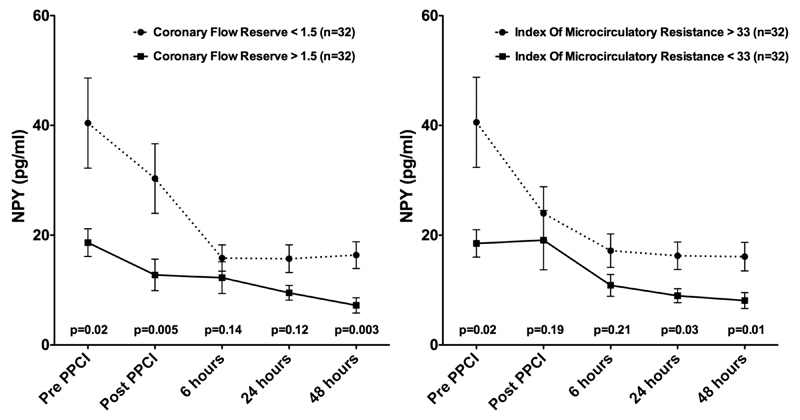
Main outcome measures: NPY was measured (ELISA) in peripheral blood taken before and immediately after PPCI and at 6, 24 and 48 h post-PPCI. Reperfusion was assessed by angiographic criteria, ST segment resolution, invasive measurement of coronary flow reserve and the index of microcirculatory resistance.
Results: Plasma NPY levels were highest before PPCI (17.4 (8.8-42.2) pg/ml, median (IQR)) and dropped significantly post-PPCI (12.4 (6.5-26.7) pg/ml, p<0.0001) and after 6 h (9.0 (2.6-21.5) pg/ml, p=0.008). Patients with admission NPY levels above the median were significantly more hypertensive and tachycardic and were more likely to have diabetes mellitus. Patients with angiographic no-reflow (less than thrombolysis in myocardial infarction 3 flow and myocardial blush grade >2, n=16) or no electrocardiographic ST resolution (<70%, n=30) following PPCI had significantly higher plasma NPY levels. Patients with a coronary flow reserve <1.5 or index of microcirculatory resistance >33 also had significantly higher plasma NPY levels pre-PPCI and post-PPCI.
Conclusions: Plasma NPY levels correlate with indices of reperfusion and coronary microvascular resistance.
Conflict of interest statement
Figures
Comment in
-
Biomarkers and ST-elevation myocardial infarction.Heart. 2013 Aug;99(16):1143. doi: 10.1136/heartjnl-2013-303667. Epub 2013 Apr 10. Heart. 2013. PMID: 23574973 No abstract available.
Similar articles
-
Predictive value of admission platelet volume indices for in-hospital major adverse cardiovascular events in acute ST-segment elevation myocardial infarction.Angiology. 2015 Feb;66(2):155-62. doi: 10.1177/0003319713513493. Epub 2013 Dec 3. Angiology. 2015. PMID: 24301422
-
Neuropeptide-Y causes coronary microvascular constriction and is associated with reduced ejection fraction following ST-elevation myocardial infarction.Eur Heart J. 2019 Jun 21;40(24):1920-1929. doi: 10.1093/eurheartj/ehz115. Eur Heart J. 2019. PMID: 30859228 Free PMC article.
-
Cytochrome c release in acute myocardial infarction predicts poor prognosis and myocardial reperfusion on contrast-enhanced magnetic resonance imaging.Coron Artery Dis. 2014 Jan;25(1):66-72. doi: 10.1097/MCA.0000000000000040. Coron Artery Dis. 2014. PMID: 24077325
-
Invasive Assessment of the Coronary Microcirculation in Reperfused ST-Segment-Elevation Myocardial Infarction Patients: Where Do We Stand?Circ Cardiovasc Interv. 2017 Mar;10(3):e004373. doi: 10.1161/CIRCINTERVENTIONS.116.004373. Circ Cardiovasc Interv. 2017. PMID: 28242607 Review.
-
Angiography-Derived and Sensor-Wire Methods to Assess Coronary Microvascular Dysfunction in Patients With Acute Myocardial Infarction.JACC Cardiovasc Imaging. 2023 Jul;16(7):965-981. doi: 10.1016/j.jcmg.2023.01.017. Epub 2023 Apr 12. JACC Cardiovasc Imaging. 2023. PMID: 37052555 Review.
Cited by
-
Remodeling of stellate ganglion neurons after spatially targeted myocardial infarction: Neuropeptide and morphologic changes.Heart Rhythm. 2015 May;12(5):1027-35. doi: 10.1016/j.hrthm.2015.01.045. Epub 2015 Jan 30. Heart Rhythm. 2015. PMID: 25640636 Free PMC article.
-
The Biochemical Markers Associated with the Occurrence of Coronary Spasm.Biomed Res Int. 2019 Sep 17;2019:4834202. doi: 10.1155/2019/4834202. eCollection 2019. Biomed Res Int. 2019. PMID: 31637257 Free PMC article. Review.
-
Autonomic control of the heart: going beyond the classical neurotransmitters.Exp Physiol. 2015 Apr 1;100(4):354-8. doi: 10.1113/expphysiol.2014.080184. Epub 2014 Nov 20. Exp Physiol. 2015. PMID: 25344273 Free PMC article. Review.
-
Deletion of Neuropeptide Y Attenuates Cardiac Dysfunction and Apoptosis During Acute Myocardial Infarction.Front Pharmacol. 2019 Oct 24;10:1268. doi: 10.3389/fphar.2019.01268. eCollection 2019. Front Pharmacol. 2019. PMID: 31708788 Free PMC article.
-
Circulating neuropeptide Y dynamics and performance during exercise in heart failure patients with contemporary medical and device therapy.Exp Physiol. 2025 Mar;110(3):401-409. doi: 10.1113/EP092325. Epub 2025 Jan 24. Exp Physiol. 2025. PMID: 39861963 Free PMC article.
References
-
- Niccoli G, Burzotta F, Galiuto L, et al. Myocardial no-reflow in humans. J Am Coll Cardiol. 2009;54:281–92. - PubMed
-
- Cuculi F, De Caterina AR, Kharbanda RK, et al. Optimal reperfusion in ST-elevation myocardial infarction—the role of the coronary microcirculation. Swiss Med Wkly. 2011;141:w13313. - PubMed
-
- Bekkers SC, Yazdani SK, Virmani R, et al. Microvascular obstruction: underlying pathophysiology and clinical diagnosis. J Am Coll Cardiol. 2010;55:1649–60. - PubMed
-
- Niccoli G, Lanza GA, Shaw S, et al. Endothelin-1 and acute myocardial infarction: a no-reflow mediator after successful percutaneous myocardial revascularization. Eur Heart J. 2006;27:1793–8. - PubMed
-
- Niccoli G, Giubilato S, Russo E, et al. Plasma levels of thromboxane A2 on admission are associated with no-reflow after primary percutaneous coronary intervention. Eur Heart J. 2008;29:1843–50. - PubMed
Publication types
MeSH terms
Substances
Grants and funding
LinkOut - more resources
Full Text Sources
Other Literature Sources
Medical
Miscellaneous