. 2013 Jun;86(1026):20120653.
doi: 10.1259/bjr.20120653. Epub 2013 Feb 12.

Gd-EOB-DTPA-enhanced MRI for the assessment of liver function and volume in liver cirrhosis

Affiliations

Gd-EOB-DTPA-enhanced MRI for the assessment of liver function and volume in liver cirrhosis

H Nilsson et al. Br J Radiol. 2013 Jun.

Abstract

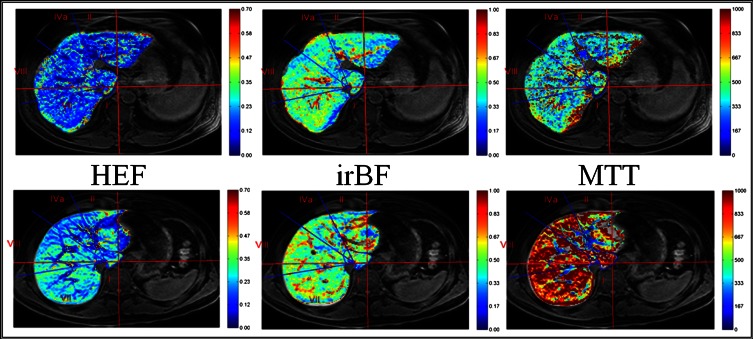
Objective: The aims of this study were to use dynamic hepatocyte-specific contrast-enhanced MRI to evaluate liver volume and function in liver cirrhosis, correlate the results with standard scoring models and explore the inhomogeneous distribution of liver function in cirrhotic livers.

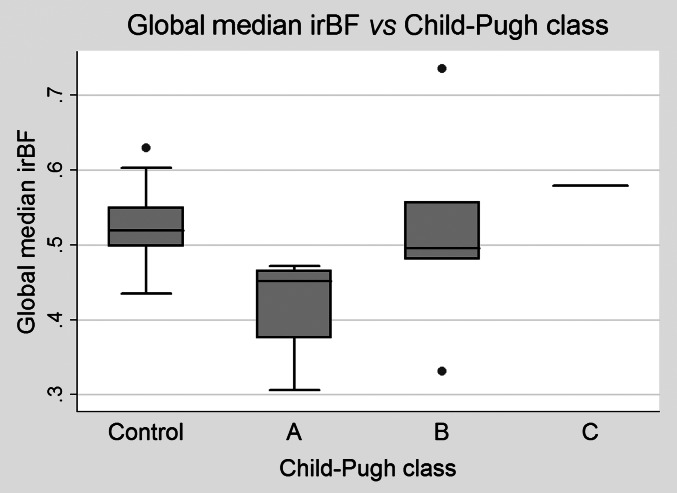
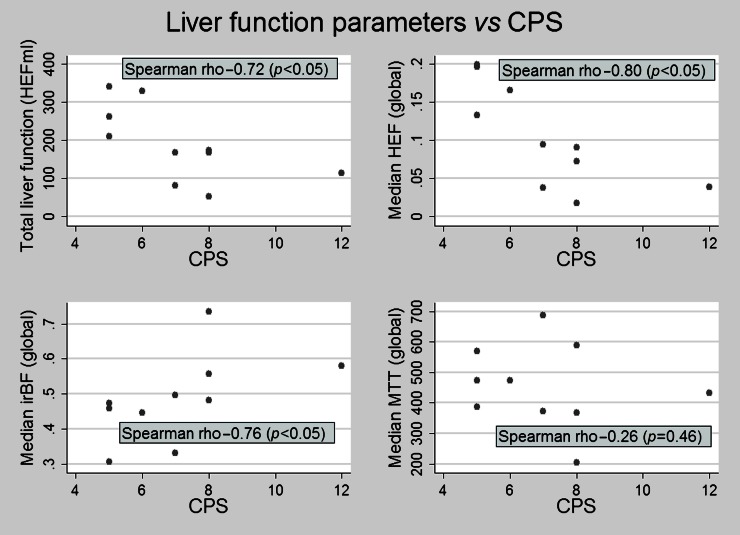
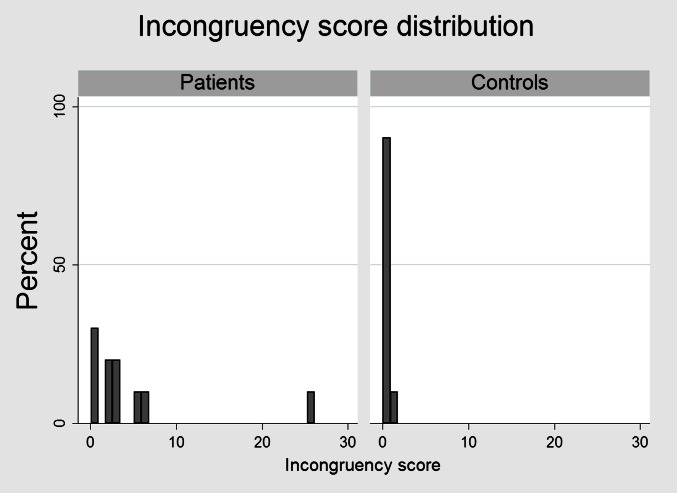
Methods: 10 patients with liver cirrhosis and 20 healthy volunteers, serving as controls, were included. Hepatic extraction fraction (HEF), input relative blood flow and mean transit time were calculated on a voxel-by-voxel basis using deconvolutional analysis. Segmental and total liver volumes as well as segmental and total hepatic extraction capacity, expressed in HEFml, were calculated. An incongruence score (IS) was constructed to reflect the uneven distribution of liver function. The Mann-Whitney U-test was used for group comparison of the quantitative liver function parameters, liver volumes and ISs. Correlations between liver function parameters and clinical scores were assessed using Spearman rank correlation.

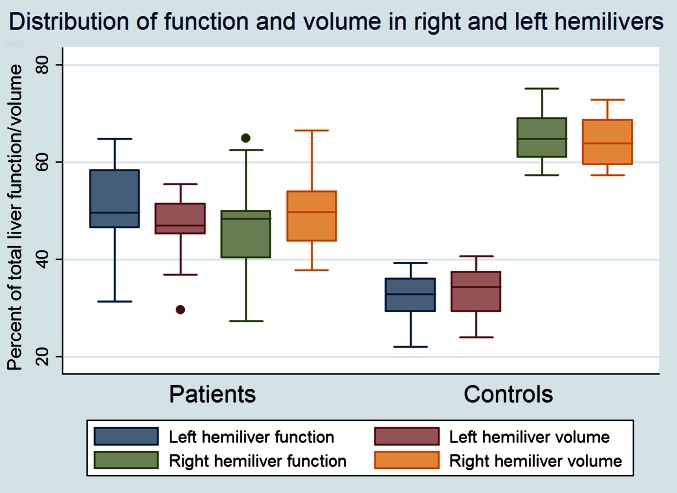
Results: Patients had larger parenchymal liver volume, lower hepatocyte function and more inhomogeneous distribution of function compared with healthy controls.

Conclusion: The study demonstrates the non-homogeneous nature of liver cirrhosis and underlines the necessity of a liver function test able to compensate for the heterogeneous distribution of liver function in patients with diseased liver parenchyma.

Advances in knowledge: The study describes a new way to quantitatively assess the hepatic uptake of gadoxetate or gadolinium ethoxybenzyl diethylenetriaminepentaacetic acid in the liver as a whole as well as on a segmental level.


Figures

Figure 1.
Figure 1.
Parametric maps of quantitative liver function parameters. T1 weighted spoiled gradient-echo images from a patient (top row) and healthy control (bottom row) where the results of the voxel-based quantitative liver function analysis are superimposed, colour-coded, on the anatomical images and presented as parametric maps are shown. The patient in the top row had the Child–Pugh score of 6 and model for end-stage liver disease score 11. The images in the middle column show input-relative blood flow (irBF) maps (perfusion) where the vascular structures are easily identified with a markedly higher irBF compared with the liver parenchyma. HEF, hepatic extraction fraction; MTT, mean transit time.
Figure 2.
Figure 2.
Liver perfusion assessed by input-relative blood flow (irBF). Liver perfusion seems to increase with disease severity graded according to Child–Pugh class as shown in this box plot. Dots outside the plot indicate outliers. There was only one observation with Child–Pugh class, and it is hence represented by a line only.
Figure 3.
Figure 3.
Correlation of Child–Pugh score (CPS) and liver function parameters. A strong and statistically significant correlation between the CPS and all liver function parameters derived from deconvolutional analysis, except mean transit time, was observed. HEF, hepatic extraction fraction; irBF, input-relative blood flow; MTT, mean transit time.
Figure 4.
Figure 4.
Distribution of incongruence score (IS) in patients and controls. Liver function was more inhomogeneously distributed among patients with a median IS of 2.7 (range 0.6–25.3) as compared with 0.4 (range 0.1–1.1) among controls (p<0.05).
Figure 5.
Figure 5.
The distribution of function and volume in the right and left hemilivers. A box-plot of the function and volume distribution in the patient and control group. Note the large variations in liver function and volumes in the patient group, with one patient having >60% of the total liver function in the left hemiliver and <30% of the function in the right hemiliver. A single dot outside the box plot represents an outlier.

References

    1. Mullen JT, Ribero D, Reddy SK, Donadon M, Zorzi D, Gautam S, et al. Hepatic insufficiency and mortality in 1,059 noncirrhotic patients undergoing major hepatectomy. J Am Coll Surg 2007;204:854–62 doi: 10.1016/j.jamcollsurg.2006.12.032; discussion 62–4 - DOI - PubMed
    1. Capussotti L, Vigano L, Giuliante F, Ferrero A, Giovannini I, Nuzzo G. Liver dysfunction and sepsis determine operative mortality after liver resection. Br J Surg 2009;96:88–94 doi: 10.1002/bjs.6429 - DOI - PubMed
    1. Balzan S, Belghiti J, Farges O, Ogata S, Sauvanet A, Delefosse D, et al. The “50-50 criteria” on postoperative day 5: an accurate predictor of liver failure and death after hepatectomy. Ann Surg 2005;242:824–8, discussion 28–9 - PMC - PubMed
    1. Sakamoto S, Uemoto S, Uryuhara K, Kim Id, Kiuchi T, Egawa H, et al. Graft size assessment and analysis of donors for living donor liver transplantation using right lobe. Transplantation 2001;71:1407–13 - PubMed
    1. Schroeder T, Radtke A, Kuehl H, Debatin JF, Malagó M, Ruehm SG. Evaluation of living liver donors with an all-inclusive 3D multi-detector row CT protocol. Radiology 2006;238:900–10 doi: 10.1148/radiol.2382050133 - DOI - PubMed

Publication types

MeSH terms