. 2013 Feb 7:7:11.
doi: 10.3389/fncir.2013.00011. eCollection 2013.

Vesicular stomatitis virus with the rabies virus glycoprotein directs retrograde transsynaptic transport among neurons in vivo

Affiliations

Vesicular stomatitis virus with the rabies virus glycoprotein directs retrograde transsynaptic transport among neurons in vivo

Kevin T Beier et al. Front Neural Circuits. .

Abstract

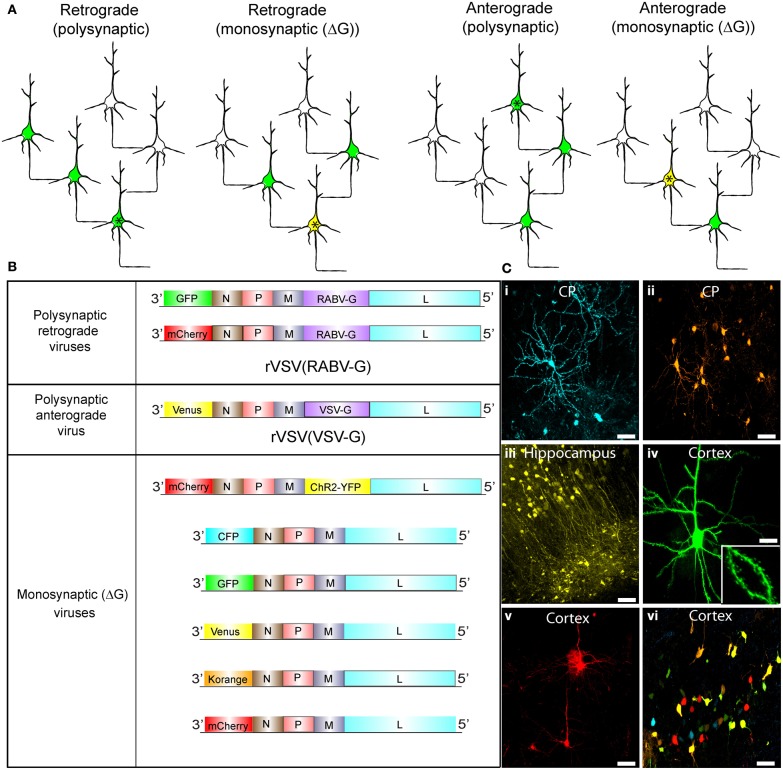
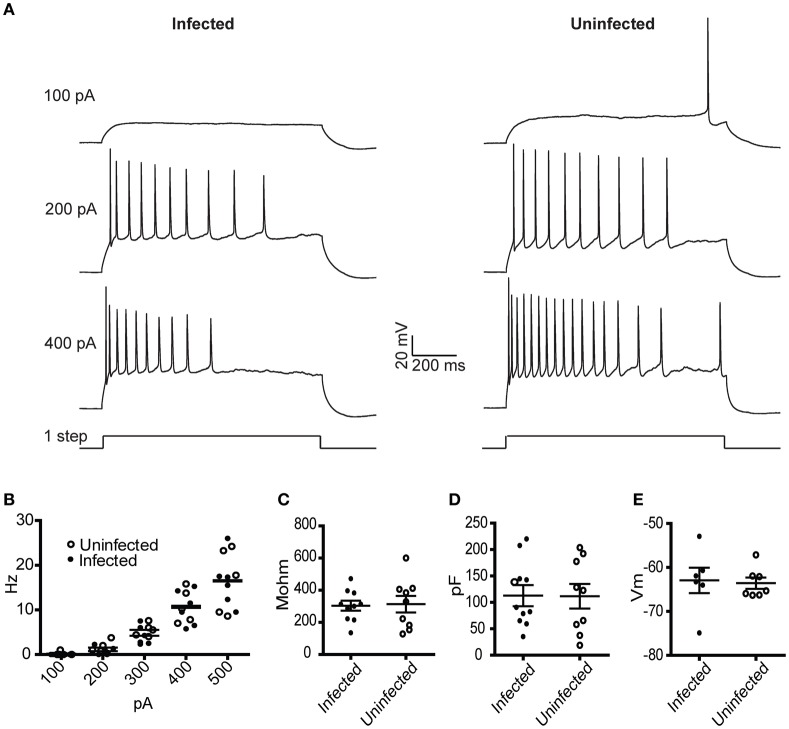
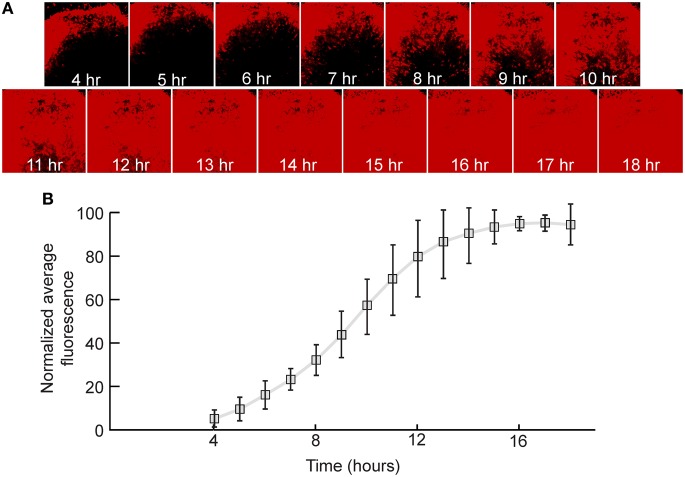
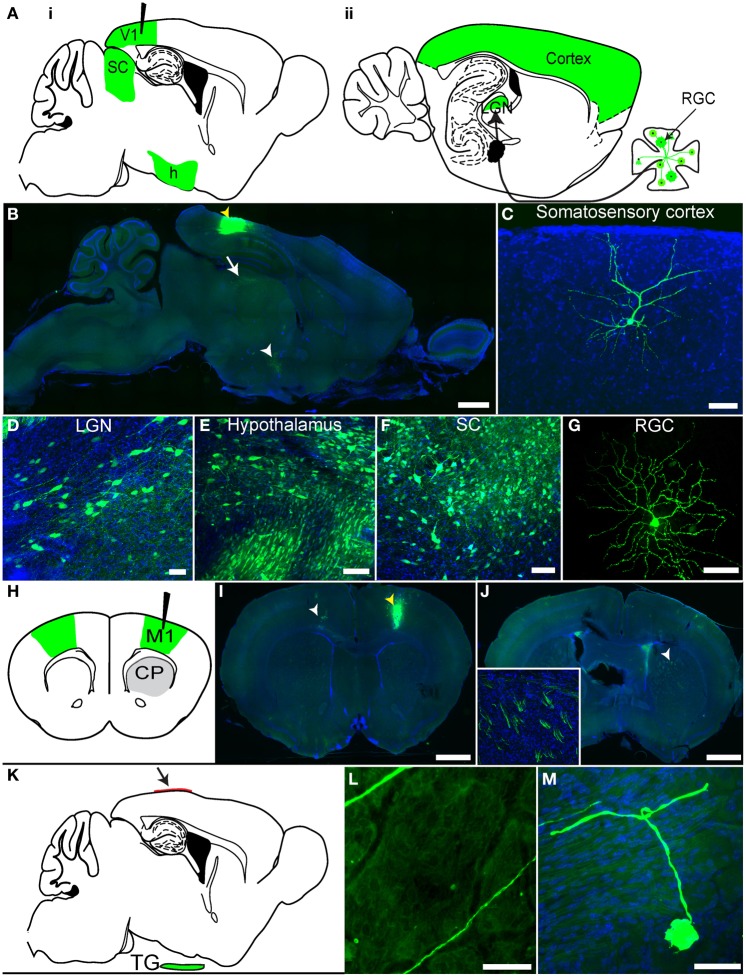
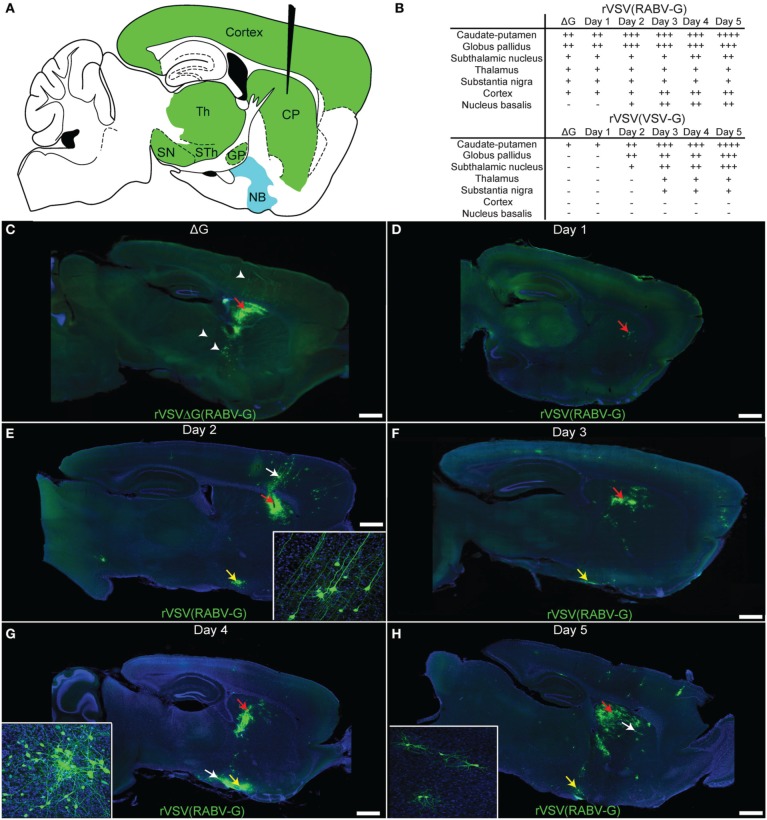
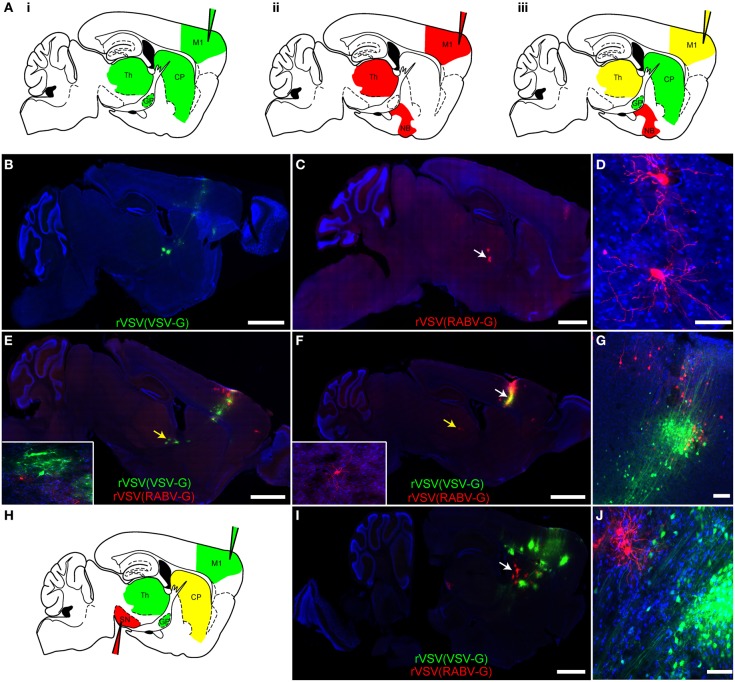
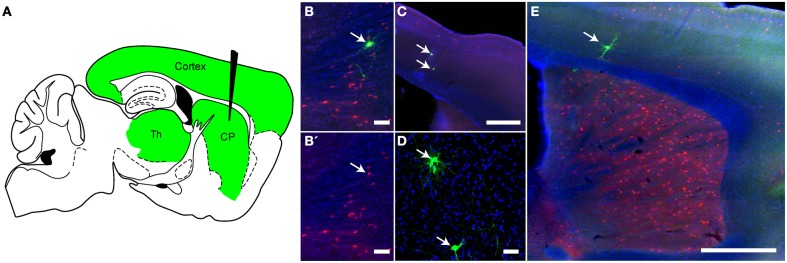
Defining the connections among neurons is critical to our understanding of the structure and function of the nervous system. Recombinant viruses engineered to transmit across synapses provide a powerful approach for the dissection of neuronal circuitry in vivo. We recently demonstrated that recombinant vesicular stomatitis virus (VSV) can be endowed with anterograde or retrograde transsynaptic tracing ability by providing the virus with different glycoproteins. Here we extend the characterization of the transmission and gene expression of recombinant VSV (rVSV) with the rabies virus glycoprotein (RABV-G), and provide examples of its activity relative to the anterograde transsynaptic tracer form of rVSV. rVSV with RABV-G was found to drive strong expression of transgenes and to spread rapidly from neuron to neuron in only a retrograde manner. Depending upon how the RABV-G was delivered, VSV served as a polysynaptic or monosynaptic tracer, or was able to define projections through axonal uptake and retrograde transport. In animals co-infected with rVSV in its anterograde form, rVSV with RABV-G could be used to begin to characterize the similarities and differences in connections to different areas. rVSV with RABV-G provides a flexible, rapid, and versatile tracing tool that complements the previously described VSV-based anterograde transsynaptic tracer.

Keywords: in vivo; polysynaptic; rabies; retrograde transneuronal tracing; technology; transsynaptic infection; vesicular stomatitis virus.


Figures

Figure 1
Figure 1
Synaptic tracing strategies using VSV. (A) Schematic illustrating the strategies for polysynaptic or monosynaptic retrograde or anterograde transsynaptic transmission of rVSV encoding GFP. The initially infected cell is indicated by an asterisk. VSV encoding a glycoprotein (G) within its genome can spread polysynaptically. The direction of the spread depends on the identity of the glycoprotein. Infected neurons are shown in green. In some cases, the initially infected starter cell can be defined by the expression of an avian receptor, TVA (tagged with a red fluorescent protein). The TVA-expressing neurons can then be specifically infected by rVSVΔG with the EnvA/RABV-G (A/RG) glycoprotein (Wickersham et al., 2007b) on the virion surface [rVSVΔG(A/RG)]. These starter cells are then yellow, due to viral GFP and mCherry from TVA-mCherry expression. For monosynaptic tracing, the G protein is expressed in trans in the TVA-expressing cell, and thus complements rVSVΔG to allow transmission in a specific direction. (B) Genomic diagrams of rVSV vectors. All VSVs contain four essential proteins: N, P, M, and L. Some viruses encode a G gene in their genome, which allows them to spread polysynaptically. rVSV vectors typically encode a transgene in the first position, while others carry an additional transgene in the G position. (C) Morphological characterization of rVSV-infected neurons in several locations within the mouse brain. (i,ii) Caudate-putamen (CP) neurons at 4 dpi from an injection of the CP with rVSV(VSV-G) viruses encoding (i) CFP or (ii) Korange. (iii) Labeled neurons of the CA1 region of the hippocampus are shown at 5 dpi following injection into the hippocampus of rVSV(VSV-G) encoding Venus. (iv,v) Cortical pyramidal neurons are shown following injection into the CP of rVSV(RABV-G) expressing (iv) GFP at 24 hpi, or (v) mCherry at 48 hpi. Inset in (iv) is a high magnification of the neuron in panel (iv), highlighting labeling of dendritic spines. (vi) Multiple viruses can be co-injected into the same animal. Here, individual rVSVΔG(VSV-G) viruses encoding CFP, GFP, Venus, Korange, and mCherry were used to infect the cortex. Scale bars = 50 μm.
Figure 2
Figure 2
Physiological characterization of rVSV-infected and uninfected layer 5 cortical pyramidal neurons following injection of rVSV(RABV-G) into the CP. Slices were cut 12 hpi and recordings were taken over the subsequent 6 h. (A) Example spike trains driven by 100, 200, and 400 pA square current pulses lasting 1 s for infected (left) and uninfected (right) neurons. (B) A summary plot showing current/action potential firing frequency relationships are unaffected by infection (infected cells, N = 7; uninfected cells, N = 6). Horizontal bars denote averages. Infection does not alter the (C) input resistance, the (D) capacitance, or (E) resting membrane voltages (infected cells, N = 10, uninfected cells, N = 9). Horizontal bars denote mean with standard error of the mean.
Figure 3
Figure 3
Quantification of viral transgene expression over time. (A) After 7 days in vitro (DIV), hippocampal slice cultures were infected with rVSVΔG(RABV-G) expressing mCherry in the first genomic position. Sample images of the same visual field are shown over time. (B) Fluorescence was quantified as a function of time and was normalized to expression at 18 hpi. The plot indicates averages ± 1 SD, N = 3.
Figure 4
Figure 4
rVSV(RABV-G) exhibits polysynaptic retrograde spread in vivo. (A) Schematics of two parasaggital sections separated by 1.3 mm are shown. rVSV(RABV-G) injected into V1 (black needle) should yield infected cells in the labeled areas shown in green, including RGCs in the retina (panel ii). Areas projecting directly to V1, such as the hypothalamus (h), LGN, as well as other cortical areas, can be labeled by direct retrograde uptake of injected virions, whereas RGCs, which project to the LGN, can only be labeled by secondary viral spread. (B) rVSV(RABV-G) was injected into V1 (yellow arrowhead), and both the brain and retina examined 7 dpi. Infection in the brain appeared to be primarily in directly projecting areas, including the surrounding cortices, the LGN (white arrow), and hypothalamus (white arrowhead). Higher magnifications of labeled cells from a V1 injection are shown in panels (C–G). (C) somatosensory cortex, 7 dpi; (D) LGN, 3 dpi; (E) hypothalamus, 3 dpi; (F) SC, 3 dpi; (G) RGC, 3 dpi. (H) Schematic of a coronal section showing rVSV(RABV-G) injected into M1 (black needle). The contralateral cortex (green) should be labeled by this virus, while at early time points such as 2 dpi, the CP, which receives projections from the cortex but does not itself send projections to the cortex, should not (gray). (I) Coronal section showing GFP-labeled neurons in M1, imaged 4 dpi. The injection site was in M1, indicated by a yellow arrowhead, with neurons projecting to the injection site indicated by the white arrowhead. (J) CP neuronal cell bodies were not labeled, but labeled cortical axon bundles running through the CP were observed (inset shows axon bundles in the area demarcated by the white arrowhead). (K–M) rVSV(RABV-G) can trace circuits into the CNS from a peripheral site. (K) Parasaggital schematic showing a predicted area of infection following infection of the dura with a retrogradely transported virus. rVSV(RABV-G) was applied to the intact dura (arrow) and if retrograde uptake and transport can occur, trigeminal ganglion neurons that project to the dura (green) should become labeled. (L) Examples of axons located on the dura, 3 dpi. Infected neuronal cell bodies were not located on the dura, (M) but instead were observed in the trigeminal ganglion. No infection of the brain was observed in these animals. Scale bars: (B,I,J) = 1 mm, (L) = 100 μm, (C–G,M) = 50 μm.
Figure 5
Figure 5
Time course of rVSV(RABV-G) spread from the CP recapitulates the connectivity of known basal ganglia-thalamo-cortical circuits. (A) A parasaggital schematic showing the relevant projections into and from the injection site in the CP. Black needle points to injection site, green = primary projecting regions, blue = secondary projecting region. CP, caudate-putamen; GP, globus pallidus; SN, substantia nigra; STh, subthalamic nucleus; Th, thalamus; NB, nucleus basalis. (B) Assessment of viral spread from rVSV(RABV-G) and rVSV(VSV-G) injections into the CP. The presence or absence of labeling is indicated by (+) and (−), respectively. The extent of labeling is indicated by the number of (+). Some animals were infected with ΔG viruses to determine which areas were labeled by direct uptake of the virions, rather than by replication and transmission. These were sacrificed at 3 dpi. (C) Parasaggital section of a brain infected with VSV[greek delta]G(RABV-G). The injection site is marked by a red arrow. Several areas that project directly to the CP were labeled due to direct uptake of the virions, including the cortex, thalamus, and GP (arrowheads), 3 dpi. (D–H) Replication-competent rVSV(RABV-G) was injected into the CP (red arrows), and the time course of labeling was monitored for 5 days [(D) 1 day, (E) 2, (F) 3, (G) 4, and (H) 5 days]. Insets show high magnifications of areas indicated by white arrows. Sections from animals at 1 dpi show labeling consistent with the initial infection [compare to rVSVΔG(RABV-G), panel C], while spread to secondarily connected areas, such as the nucleus basalis, was observed at 2 dpi (yellow arrows). Viral spread was relatively restricted to the basal ganglia circuit, even out to 5 dpi. Scale bars = 1 mm.
Figure 6
Figure 6
Simultaneous anterograde and retrograde transsynaptic circuit tracing using rVSV. (A) Connectivity schematics of parasaggital sections indicating patterns of spread from injection of M1 (injection needles) with a polysynaptic virus transmitting across synapses in the (i) anterograde or (ii) retrograde directions. Panel (iii) shows the pattern from co-injection of two polysynaptic viruses, one anterograde and one retrograde. Green represents the anterograde virus, red the retrograde virus, and yellow, both. Note that yellow indicates that the area is predicted to host infection by both viruses, with potentially some individual cells showing infection with both viruses. (B) The anterograde transsynaptic virus rVSV(VSV-G), when injected alone, labeled M1 as well as anterograde projection areas, such as the CP, GP, and thalamus, whereas (C) the retrograde virus rVSV(RABV-G) labeled M1 as well as areas projecting to the cortex, including the thalamus. (D) High magnification of thalamic cells shown in (C) (white arrow). (E,F) Examples taken from a series of parasaggital sections from the same brain of an animal injected with both viruses simultaneously into M1. Co-infection of cells in M1 was not observed, (G), and no spurious labeling of anterograde or retrograde projection regions was observed—i.e., the combination of viruses was equal to the sum of each virus injected individually. Insets show high magnifications of thalamic neurons in (E) and (F) labeled by the two viruses (indicated by the yellow arrows) demonstrating no co-labeling. (G) A high magnification view of the injection site in the cortex shown in panel (F) (white arrow), showing independent labeling of neurons by each virus. (H) A schematic of a parasaggital section depicting the pattern of transmission of an anterograde (green) and retrograde (red) virus injected into two different areas of the basal ganglia circuit. This strategy can be used to connect multiple elements in a circuit. The rVSV(VSV-G) that expressed Venus (labeled cells depicted in green) was injected into M1, while the rVSV(RABV-G) that expressed mCherry was injected into the SN, where it labeled direct pathway MSNs in the CP (yellow). (I) Using these coordinates, largely non-overlapping regions of the CP were labeled by these viruses, as shown in (J). Scale bars: (B,C,E,F,I) = 1 mm; (D,G,J) = 50 μm.
Figure 7
Figure 7
Monosynaptic retrograde tracing using rVSV in vivo. (A) A schematic of a parasaggital section showing the predicted pattern of monosynaptic retrograde spread from Choline Acetyltransferase (ChAT)-expressing neurons in the CP to directly connected cells. A combination of two Cre-dependent adeno-associated viruses (AAVs), one expressing a TVA-mCherry fusion protein and the other RABV-G, were injected into the CP of ChAT-Cre/Ai9 animals. This permits expression of the transgenes encoded in the AAVs in cells with a ChAT expression history. Two weeks later, rVSVΔG(A/RG), a G-deleted virus that only infects TVA-expressing neurons, was injected into the same region, and the brain was observed 5 days later. The injection of rVSV into the CP (black needle) should result in infection of TVA-expressing neurons in the CP. From these starter cells, monosynaptic spread could occur only to directly connected inputs such as those in the cortex and thalamus (green). (B,B′) Initially infected cells in the CP were both red (TVA-expressing) and green (rVSV infected) (arrow). B′ shows the red and blue channels only, blue = DAPI. (C–E) Examples of rVSV-infected cells in the cortex (C,E) and thalamus (D) that were infected by monosynaptic transmission from the starter cells, (arrows indicate cells infected by transmission), N = 3. Scale bars: (B,D) = 50 μm, (C,E) = 500 μm.

References

    1. Ahmed M., Lyles D. S. (1998). Effect of vesicular stomatitis virus matrix protein on transcription directed by host RNA polymerases, I, II, and III. J. Virol. 72, 8413–8419 - PMC - PubMed
    1. Albin R. L., Young A. B., Penney J. B. (1995). The functional anatomy of disorders of the basal ganglia. Trends Neurosci. 18, 63–64 10.1016/0166-2236(95)80020-3 - DOI - PubMed
    1. Astic L., Saucier D., Coulon P., Lafay F., Flamand A. (1993). The CVS strain of rabies virus as transneuronal tracer in the olfactory system of mice. Brain Res. 619, 146–156 10.1016/0006-8993(93)91606-S - DOI - PubMed
    1. Balachandran S., Barber G. N. (2000). Vesicular stomatitis virus (VSV) therapy of tumors. IUBMB Life 50, 135–138 10.1080/713803696 - DOI - PubMed
    1. Beier K. T., Saunders A., Oldenburg I. A., Miyamichi K., Akhtar N., Luo L., et al. (2011). Anterograde or retrograde transsynaptic labeling of CNS neurons with vesicular stomatitis virus vectors. Proc. Natl. Acad. Sci. U.S.A. 108, 15414–15419 10.1073/pnas.1110854108 - DOI - PMC - PubMed

Publication types

Substances