. 2013 Apr 25;121(17):3364-74.
doi: 10.1182/blood-2012-09-456400. Epub 2013 Feb 12.

PKR regulates proliferation, differentiation, and survival of murine hematopoietic stem/progenitor cells

Affiliations

PKR regulates proliferation, differentiation, and survival of murine hematopoietic stem/progenitor cells

Xiangfei Liu et al. Blood. .

Abstract

Protein kinase R (PKR) is an interferon (IFN)-inducible, double-stranded RNA-activated kinase that initiates apoptosis in response to cellular stress. To determine the role of PKR in hematopoiesis, we developed transgenic mouse models that express either human PKR (TgPKR) or a dominant-negative PKR (TgDNPKR) mutant specifically in hematopoietic tissues. Significantly, peripheral blood counts from TgPKR mice decrease with age in association with dysplastic marrow changes. TgPKR mice have reduced colony-forming capacity and the colonies also are more sensitive to hematopoietic stresses. Furthermore, TgPKR mice have fewer hematopoietic stem/progenitor cells (HSPCs), and the percentage of quiescent (G0) HSPCs is increased. Importantly, treatment of TgPKR bone marrow (BM) with a PKR inhibitor specifically rescues sensitivity to growth factor deprivation. In contrast, marrow from PKR knockout (PKRKO) mice has increased potential for colony formation and HSPCs are more actively proliferating and resistant to stress. Significantly, TgPKR HSPCs have increased expression of p21 and IFN regulatory factor, whereas cells from PKRKO mice display mechanisms indicative of proliferation such as reduced eukaryotic initiation factor 2α phosphorylation, increased extracellular signal-regulated protein kinases 1 and 2 phosphorylation, and increased CDK2 expression. Collectively, data reveal that PKR is an unrecognized but important regulator of HSPC cell fate and may play a role in the pathogenesis of BM failure.


Figures
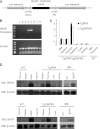
Figure 1
Figure 1
Mice are generated that express either a TgPKR or DNPKR mutant transgene exclusively in hematopoietic tissues. (A) Schematic of construct used for pronuclear injection. (B) PCR analysis of tail DNA to detect transgenic mice with primers specific for TgPKR. PCR for β-actin was used as an endogenous control. Lanes 4 and 5 are transgenic pups; others are WT siblings. (C) Real-time PCR assays of TgPKR or DNPKR expression in the indicated tissues of transgenic mice. Data represent relative mRNA levels (mean ± SEM, n = 3) normalized to mouse β-actin in arbitrary units. (D) Total cell lysates were analyzed by western blot for TgPKR or DNPKR protein expression in the tissues indicated.
Figure 2
Figure 2
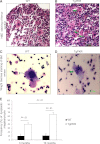
Transgenic expression of PKR induces BM dysplasia in TgPKR mice. (A and B) Hematoxylin and eosin (H&E) staining of paraffin-embedded sections of femur (for BM) from WT control and TgPKR mice as indicated. White arrows point to normal megakaryocytes. Green arrows indicate dysplastic megakaryocytes with single nuclear lobe or with multiple separated nuclear lobes. (C and D) Wright-Giemsa staining of BM smears from WT control or TgPKR mice as indicated. White arrows indicate normal megakaryocytes. Green arrow indicates a dysplastic megakaryocyte with multiple separated nuclear lobes. (E) Graph showing percentage of dysplastic megakaryocytes in 3- vs 10-month-old WT or TgPKR mice. Five mice of each genotype were analyzed with 200 megakaryocytes counted per specimen.
Figure 3
Figure 3
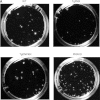
PKR regulates clonogenic potential of BM progenitors both in vitro and in vivo. (A) Representative colonies after culture of WT, TgPKR, TgDNPKR, or PKRKO BM cells from 3- to 5-month-old mice in methylcellulose for 7 days. (B-F) Unfractionated BM cells (2 × 10⁴ for B, C, D, and E, 105 for F) from WT, TgPKR, TgDNPKR, or PKRKO mice were plated and resulting CFU-GEMM (B), CFU-GM (C), CFU-G (D), CFU-M (E), and BFU-E (F) counted. BM from 5 mice of each genotype was assayed and mean ± SEM graphed. (G) Representative examples of macroscopic spleen colonies (CFU-S) from WT irradiated recipients injected with 2 × 10⁴ unfractionated BM cells either from WT, TgPKR, TgDNPKR, or PKRKO mice as indicated. (H) Colonies were counted 10 days after transplantation. Graphs represent mean ± SEM (n = 4 donor mice of each genotype).
Figure 3
Figure 3
PKR regulates clonogenic potential of BM progenitors both in vitro and in vivo. (A) Representative colonies after culture of WT, TgPKR, TgDNPKR, or PKRKO BM cells from 3- to 5-month-old mice in methylcellulose for 7 days. (B-F) Unfractionated BM cells (2 × 10⁴ for B, C, D, and E, 105 for F) from WT, TgPKR, TgDNPKR, or PKRKO mice were plated and resulting CFU-GEMM (B), CFU-GM (C), CFU-G (D), CFU-M (E), and BFU-E (F) counted. BM from 5 mice of each genotype was assayed and mean ± SEM graphed. (G) Representative examples of macroscopic spleen colonies (CFU-S) from WT irradiated recipients injected with 2 × 10⁴ unfractionated BM cells either from WT, TgPKR, TgDNPKR, or PKRKO mice as indicated. (H) Colonies were counted 10 days after transplantation. Graphs represent mean ± SEM (n = 4 donor mice of each genotype).
Figure 4
Figure 4
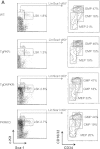
In vivo sizes of HSPC compartments and development of granulocyte/monocytes is altered in TgPKR transgenic and PKR knockout mice. (A) BM from 3- to 5-month-old mice was stained for lineage markers Lin, Sca-1, c-Kit, CD34, and CD16/32. The CD34 and CD16/32 staining of the Lin, c-Kit+ subset was used to discriminate between hematopoietic progenitor cell populations. (B) Graph depicting the relative frequency of LSK hematopoietic stem cells in total BM. (C) The frequency of CMP cells in BM. (D) The frequency of MEP cells in total BM. (E) The frequency of GMP cells in total BM. (F) BM was stained for the monocyte marker CD11b and measured by flow cytometry. Graph shows the frequency of CD45+CD11b+ monocytes in total BM. (G) Graph of the average relative frequency of granulocytes (CD45+Gr-1+) in total BM cells. For all graphs the average data from 5 mice of each genotype is represented.
Figure 4
Figure 4
In vivo sizes of HSPC compartments and development of granulocyte/monocytes is altered in TgPKR transgenic and PKR knockout mice. (A) BM from 3- to 5-month-old mice was stained for lineage markers Lin, Sca-1, c-Kit, CD34, and CD16/32. The CD34 and CD16/32 staining of the Lin, c-Kit+ subset was used to discriminate between hematopoietic progenitor cell populations. (B) Graph depicting the relative frequency of LSK hematopoietic stem cells in total BM. (C) The frequency of CMP cells in BM. (D) The frequency of MEP cells in total BM. (E) The frequency of GMP cells in total BM. (F) BM was stained for the monocyte marker CD11b and measured by flow cytometry. Graph shows the frequency of CD45+CD11b+ monocytes in total BM. (G) Graph of the average relative frequency of granulocytes (CD45+Gr-1+) in total BM cells. For all graphs the average data from 5 mice of each genotype is represented.
Figure 5
Figure 5
PKR regulates quiescence and cell-cycle progression of HSPCs. (A) Flow cytometry analysis of DNA content and Ki67 expression in Linc-Kit+ BM cells from WT, TgPKR, TgDNPKR, or PKRKO mice. Numbers on the plot are the frequency of cells in the indicated cell-cycle phases. (B) Proliferation of Linc-Kit+ BM cells from WT, TgPKR, TgDNPKR, or PKRKO mice in vitro under standard growth conditions was measured by flow cytometry (n = 5). (C) Western blotting of Linc-Kit+ BM cells from WT, TgPKR, TgDNPKR, or PKRKO mice to investigate the mechanisms of PKR-dependent proliferation and cell cycle regulation. The cells from 5 mice for each genotype were pooled for western blotting. (D) Differentiation of Linc-Kit+ cells from WT, TgPKR, TgDNPKR, or PKRKO mice into CD11b+Gr1+ cells was measured by flow cytometry after culture under standard growth conditions.
Figure 6
Figure 6
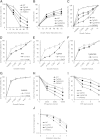
PKR regulates survival of clonogenic BM progenitor cells in vitro after hematopoietic growth factor deprivation, inflammatory cytokine treatment, or γ-irradiation. The colony formation data are expressed as percent of maximal numbers of colonies. Mean actual maximal colony counts per 2 × 10⁴ cells were WT = 70.4, TgPKR = 53.4, TgDNPKR = 77, and PKRKO = 111.6. (A) BM cells were cultured in media without growth factors for the indicated times. Cells (2 × 10⁴) were then plated in methylcellulose-based media containing 1× growth factors (50 ng/mL SCF, 10 ng/mL IL-3, 10 ng/mL IL-6, and 3U/mL EPO) and colonies scored after 7 days (n = 3). (B) Linc-Kit+ cells were isolated from BM of WT, TgPKR, TgDNPKR, or PKRKO mice and cultured in media without growth factors. At the indicated times, measurement of Annexin V staining was performed by flow cytometry to determine apoptosis. (n = 3). (C) BM cells (2 × 10⁴) were plated in methylcellulose-based media containing various concentrations of the hematopoietic growth factor cocktail (0.0675× to 1×, 1× = 50 ng/mL SCF, 10 ng/mL IL-3, 10 ng/mL IL-6, and 3U/mL EPO) and hematopoietic colony formation scored. (D-G) Cells (2 × 10⁴) were plated in methylcellulose-based media containing various concentrations of the hematopoietic growth factor cocktail and 300nM of either PKRI or inactive control. (H) Hematopoietic colony formation was assayed in medium containing 1× growth factors and the indicated concentration of IFN-γ. (I) Hematopoietic colony formation was assayed in medium containing 1× growth factors and the indicated concentration of TNF-α. (J) Hematopoietic colony formation was assayed after irradiation of BM cells with the indicated doses of γ-irradiation. (For all colony-formation assays, colonies were scored after 7 days’ growth and results are the average of BM from 3 mice [n = 3] for each genotype.)

References

    1. Blalock WL, Weinstein-Oppenheimer C, Chang F, et al. Signal transduction, cell cycle regulatory, and anti-apoptotic pathways regulated by IL-3 in hematopoietic cells: possible sites for intervention with anti-neoplastic drugs. Leukemia. 1999;13(8):1109–1166. - PubMed
    1. Hapel AJ, Fung MC, Johnson RM, et al. Biologic properties of molecularly cloned and expressed murine interleukin-3. Blood. 1985;65(6):1453–1459. - PubMed
    1. Matsumoto A, Nakayama KI. Role of key regulators of the cell cycle in maintenance of hematopoietic stem cells. Biochim Biophys Acta. 2013;1830(2):2335–2344. - PubMed
    1. Liesveld JL, Jordan CT, Phillips GL., II The hematopoietic stem cell in myelodysplasia. Stem Cells. 2004;22(4):590–599. - PubMed
    1. Lécuyer E, Hoang T. SCL: from the origin of hematopoiesis to stem cells and leukemia. Exp Hematol. 2004;32(1):11–24. - PubMed

Publication types

MeSH terms