. 2013 Feb 13;309(6):587-93.
doi: 10.1001/jama.2013.333.

Relationship between hospital readmission and mortality rates for patients hospitalized with acute myocardial infarction, heart failure, or pneumonia

Affiliations

Relationship between hospital readmission and mortality rates for patients hospitalized with acute myocardial infarction, heart failure, or pneumonia

Harlan M Krumholz et al. JAMA. .

Abstract

Importance: The Centers for Medicare & Medicaid Services publicly reports hospital 30-day, all-cause, risk-standardized mortality rates (RSMRs) and 30-day, all-cause, risk-standardized readmission rates (RSRRs) for acute myocardial infarction, heart failure, and pneumonia. The evaluation of hospital performance as measured by RSMRs and RSRRs has not been well characterized.

Objective: To determine the relationship between hospital RSMRs and RSRRs overall and within subgroups defined by hospital characteristics.

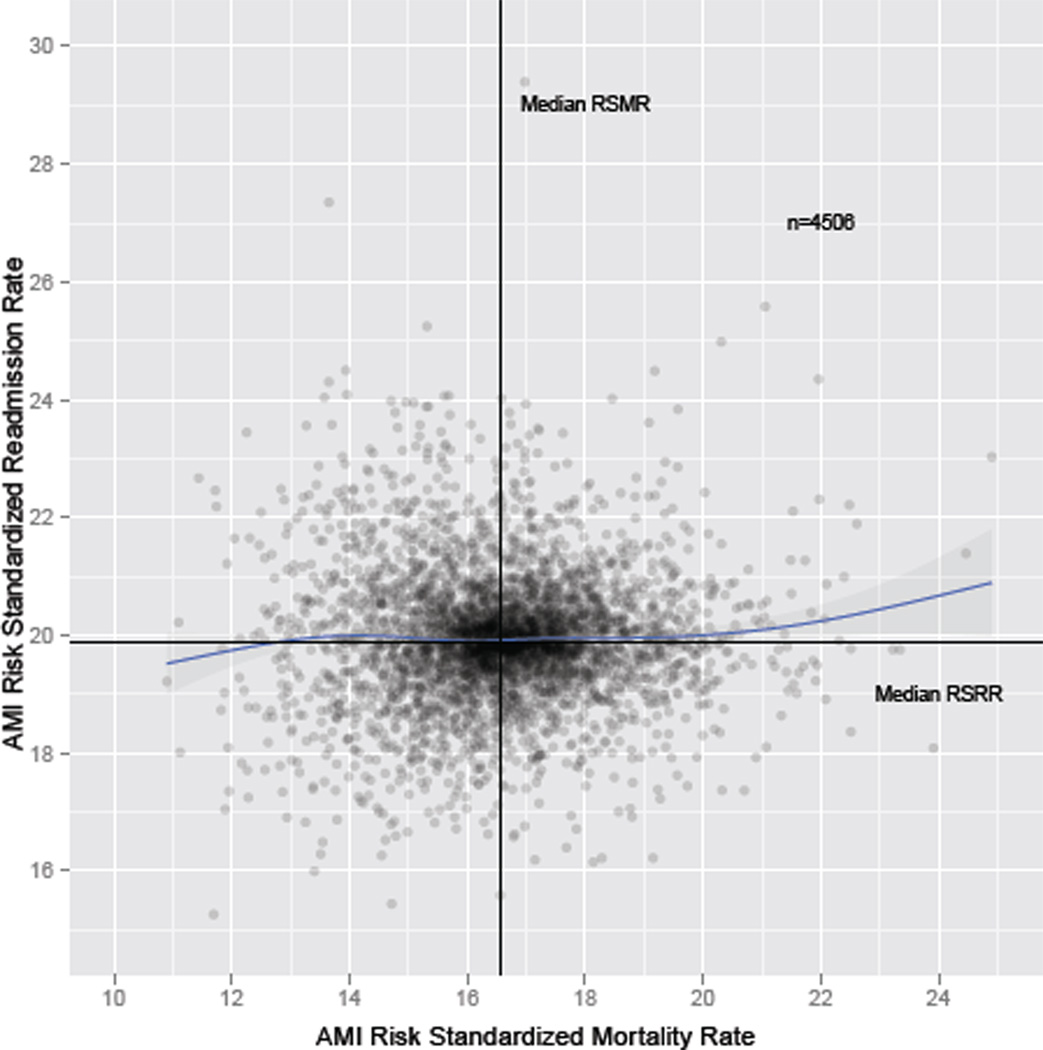
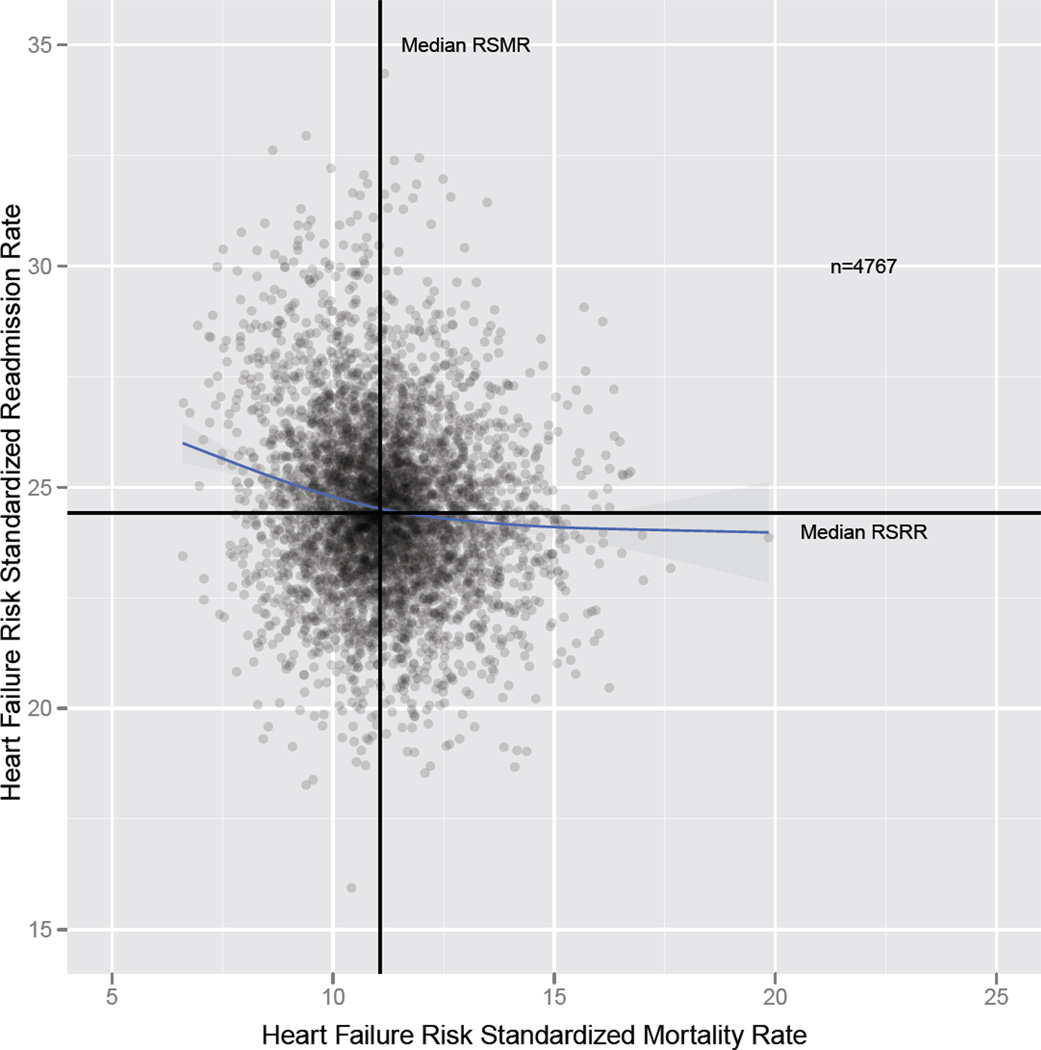
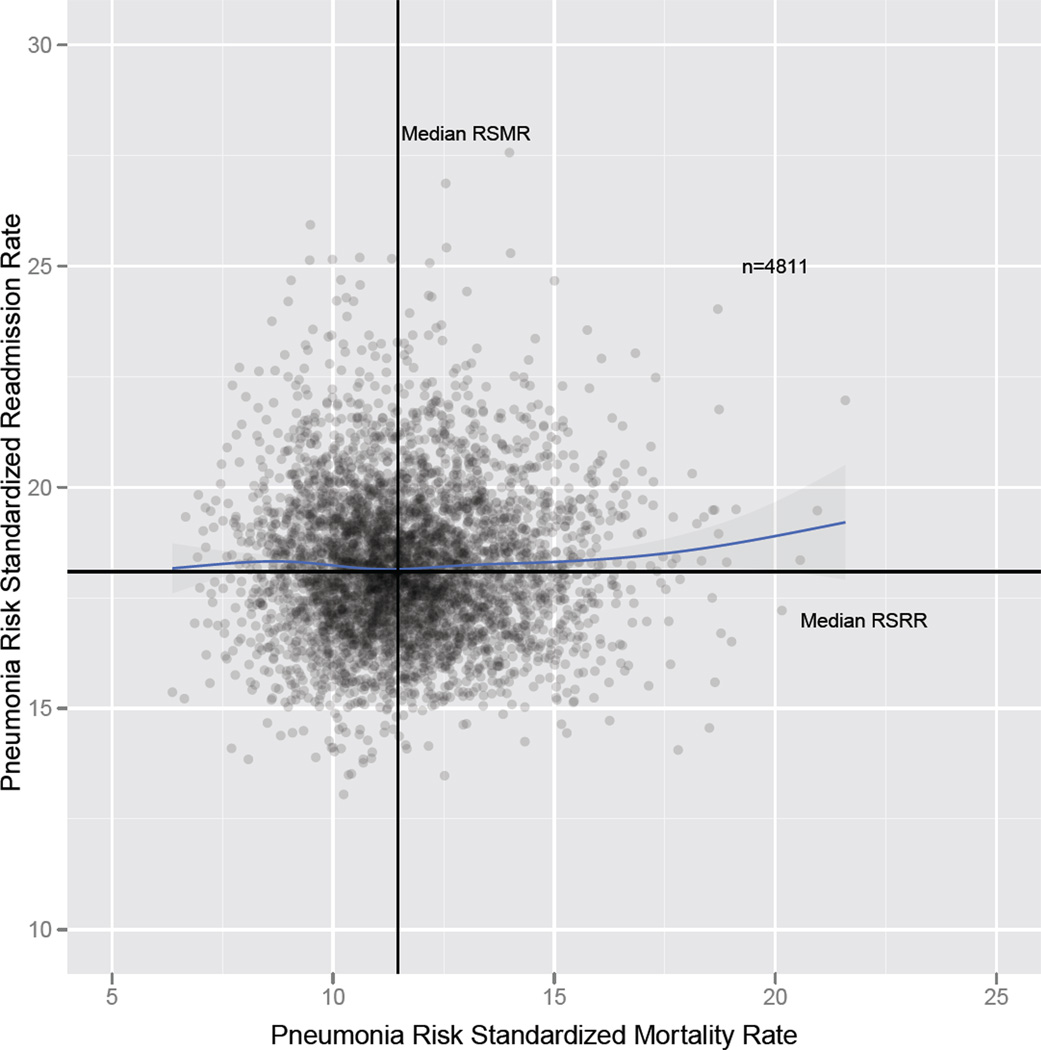
Design, setting, and participants: We studied Medicare fee-for-service beneficiaries discharged with acute myocardial infarction, heart failure, or pneumonia between July 1, 2005, and June 30, 2008 (4506 hospitals for acute myocardial infarction, 4767 hospitals for heart failure, and 4811 hospitals for pneumonia). We quantified the correlation between hospital RSMRs and RSRRs using weighted linear correlation; evaluated correlations in groups defined by hospital characteristics; and determined the proportion of hospitals with better and worse performance on both measures.

Main outcome measures: Hospital 30-day RSMRs and RSRRs.

Results: Mean RSMRs and RSRRs, respectively, were 16.60% and 19.94% for acute myocardial infarction, 11.17% and 24.56% for heart failure, and 11.64% and 18.22% for pneumonia. The correlations between RSMRs and RSRRs were 0.03 (95% CI, -0.002 to 0.06) for acute myocardial infarction, -0.17 (95% CI, -0.20 to -0.14) for heart failure, and 0.002 (95% CI, -0.03 to 0.03) for pneumonia. The results were similar for subgroups defined by hospital characteristics. Although there was a significant negative linear relationship between RSMRs and RSRRs for heart failure, the shared variance between them was only 2.9% (r2 = 0.029), with the correlation most prominent for hospitals with RSMR <11%.

Conclusion and relevance: Risk-standardized mortality rates and readmission rates were not associated for patients admitted with an acute myocardial infarction or pneumonia and were only weakly associated, within a certain range, for patients admitted with heart failure.


Conflict of interest statement

Conflict of Interest Disclosures: Drs. Krumholz and Ross report that they are recipients of a research grant from Medtronic through Yale University. Dr. Krumholz chairs a cardiac scientific advisory board for UnitedHealth, and Dr. Ross is a member of a scientific advisory board for FAIR Health. Dr. Normand is a member of the Board of Directors of Frontier Science and Technology. The remaining authors report no conflicts of interest.

Figures

Figure 1
Figure 1
a. Scatterplot of hospital-level RSMRs and RSRRs for AMI. Axes show the mean RSMRs and RSRRs. The Pearson correlation coefficient is 0.03 (−0.002, 0.056). The blue line is the cubic spline smooth regression line with RSRR as the dependent variable and RSMR as the independent variable. The tinted area around the cubic spline regression line indicates a 95% confidence band. b. Scatterplot of hospital-level RSMRs and RSRRs for HF. Axes show the mean RSMRs and RSRRs. The Pearson correlation coefficient is −0.17 (−0.200, −0.145). The blue line is the cubic spline smooth regression line with RSRR as the dependent variable and RSMR as the independent variable. The tinted area around the cubic spline regression line indicates a 95% confidence band. c. Scatterplot of hospital-level RSMRs and RSRRs for pneumonia. Axes show the mean RSMRs and RSRRs. The Pearson correlation coefficient is 0.002 (−0.026, 0.031). The blue line is the cubic spline smooth regression line with RSRR as the dependent variable and RSMR as the independent variable. The tinted area around the cubic spline regression line indicates a 95% confidence band. Abbreviations: AMI, acute myocardial infarction; HF, heart failure; RSMR, risk-standardized mortality rate; RSRR, risk-standardized readmission rate
Figure 1
Figure 1
a. Scatterplot of hospital-level RSMRs and RSRRs for AMI. Axes show the mean RSMRs and RSRRs. The Pearson correlation coefficient is 0.03 (−0.002, 0.056). The blue line is the cubic spline smooth regression line with RSRR as the dependent variable and RSMR as the independent variable. The tinted area around the cubic spline regression line indicates a 95% confidence band. b. Scatterplot of hospital-level RSMRs and RSRRs for HF. Axes show the mean RSMRs and RSRRs. The Pearson correlation coefficient is −0.17 (−0.200, −0.145). The blue line is the cubic spline smooth regression line with RSRR as the dependent variable and RSMR as the independent variable. The tinted area around the cubic spline regression line indicates a 95% confidence band. c. Scatterplot of hospital-level RSMRs and RSRRs for pneumonia. Axes show the mean RSMRs and RSRRs. The Pearson correlation coefficient is 0.002 (−0.026, 0.031). The blue line is the cubic spline smooth regression line with RSRR as the dependent variable and RSMR as the independent variable. The tinted area around the cubic spline regression line indicates a 95% confidence band. Abbreviations: AMI, acute myocardial infarction; HF, heart failure; RSMR, risk-standardized mortality rate; RSRR, risk-standardized readmission rate

References

    1. Bernheim SM, Grady JN, Lin Z, et al. National patterns of risk-standardized mortality and readmission for acute myocardial infarction and heart failure. Update on publicly reported outcomes measures based on the 2010 release. Circ Cardiovasc Qual Outcomes. 2010 Sep;3(5):459–467. - PMC - PubMed
    1. Keenan PS, Normand S-LT, Lin Z, et al. An administrative claims measure suitable for profiling hospital performance on the basis of 30-day all-cause readmission rates among patients with heart failure. Circulation. 2008;1(1):29–37. - PubMed
    1. Krumholz HM, Merrill AR, Schone EM, et al. Patterns of hospital performance in acute myocardial infarction and heart failure 30-day mortality and readmission. Circ Cardiovasc Qual Outcomes. 2009 Sep;2(5):407–413. - PubMed
    1. Krumholz HM, Wang Y, Mattera JA, et al. An administrative claims model suitable for profiling hospital performance based on 30-day mortality rates among patients with heart failure. Circulation. 2006 Apr 4;113(13):1693–1701. - PubMed
    1. Krumholz HM, Wang Y, Mattera JA, et al. An administrative claims model suitable for profiling hospital performance based on 30-day mortality rates among patients with an acute myocardial infarction. Circulation. 2006 Apr 4;113(13):1683–1692. - PubMed

Publication types

MeSH terms