. 2013 Feb 7:7:13.
doi: 10.3389/fncir.2013.00013. eCollection 2013.

Beyond the frontiers of neuronal types

Affiliations

Beyond the frontiers of neuronal types

Demian Battaglia et al. Front Neural Circuits. .

Abstract

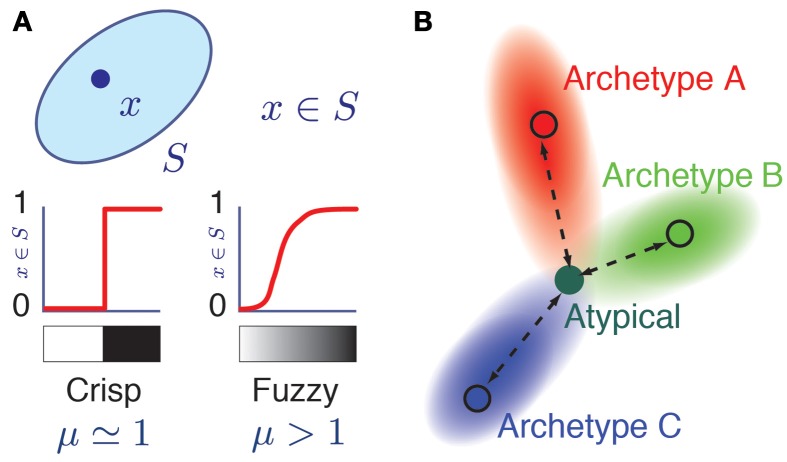
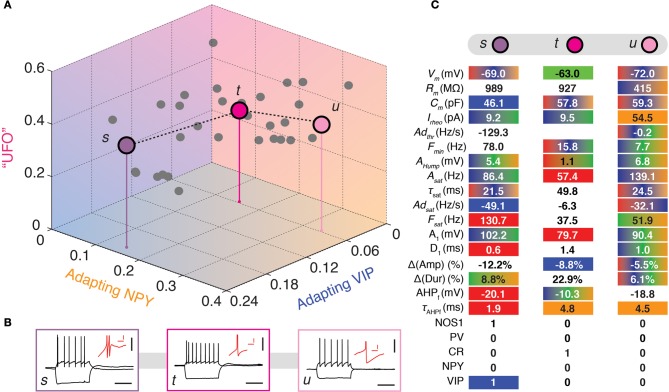
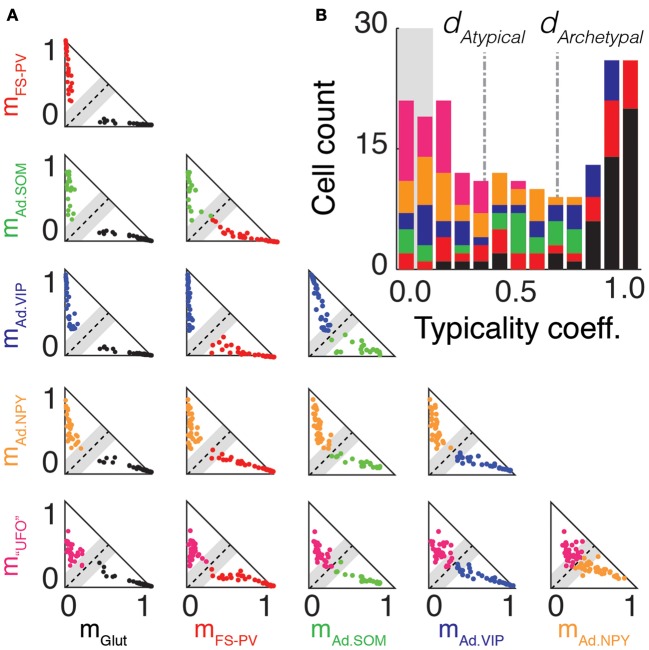
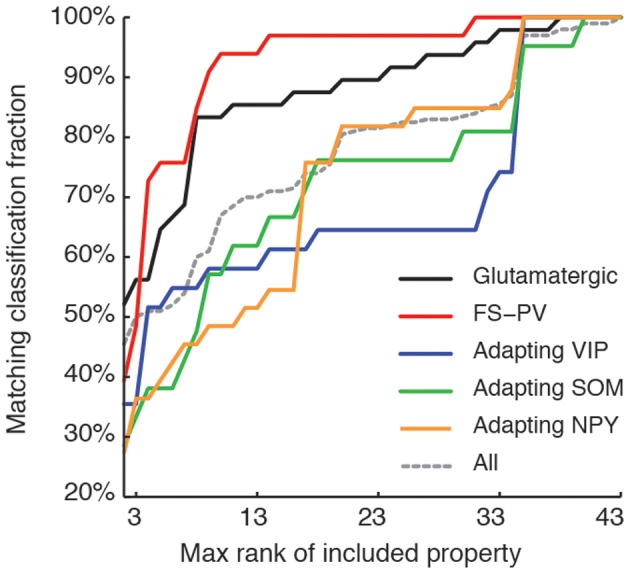
Cortical neurons and, particularly, inhibitory interneurons display a large diversity of morphological, synaptic, electrophysiological, and molecular properties, as well as diverse embryonic origins. Various authors have proposed alternative classification schemes that rely on the concomitant observation of several multimodal features. However, a broad variability is generally observed even among cells that are grouped into a same class. Furthermore, the attribution of specific neurons to a single defined class is often difficult, because individual properties vary in a highly graded fashion, suggestive of continua of features between types. Going beyond the description of representative traits of distinct classes, we focus here on the analysis of atypical cells. We introduce a novel paradigm for neuronal type classification, assuming explicitly the existence of a structured continuum of diversity. Our approach, grounded on the theory of fuzzy sets, identifies a small optimal number of model archetypes. At the same time, it quantifies the degree of similarity between these archetypes and each considered neuron. This allows highlighting archetypal cells, which bear a clear similarity to a single model archetype, and edge cells, which manifest a convergence of traits from multiple archetypes.

Keywords: atypical cells; barrel cortex; fuzzy sets; interneuron diversity; neuronal diversity; petilla terminology; unsupervised clustering.


Figures

Figure 1
Figure 1
Fuzzy membership to a class. (A) Grayscale representation of the membership relation x = S in ordinary (left) and fuzzy (right) set theories. Here, μ is a fuzziness parameter. When μ = 1, membership relations are crisp as in ordinary set theory, while for μ > 1, membership is a soft relation. The two possible values of a crisp membership are represented by white (mS(x) = 0, x does not belong to S) and black nuances (mS(x) = 1). The graded membership in fuzzy sets (0 < mS(x) < 1) is represented by a grayscale gradient. (B) Color coded representation of an atypical cell having memberships with different archetypes. Its hue corresponds to a triple membership between archetypes A (Red), B (Green), and C (Blue) archetypes in the RGB color model.
Figure 2
Figure 2
Emergence of archetypes. Fuzzy partitions with decreasing μ values are visualized as membership matrices (A–D, upper panels). Rows correspond to different fuzzy clusters and columns to individual neurons. Membership values of single neurons to each class are color coded (right bars). Schematic representation of the interrelations between archetypes (lower panels). Colored discs depict different archetypes and their overlaps denote cells with shared memberships. The Glutamatergic archetype is the first to emerge (black, A), followed by FS-PV interneurons (Red, B), and Adapting VIP interneurons (blue, C). Note that the glutamatergic archetype splits into three sub-groups. Adapting SOM (green) and Adapting NPY (orange) archetypes and a residual UFO archetype of highly atypical inhibitory interneurons are the last groups to singularize (D). (E) Effective number of clusters generated by different fuzziness parameters. The number of archetypes included in the partition is indicated to the left of the corresponding range of μ. Partitions with more than eight archetypes can be only retrieved within very narrow ranges of low μ values (red). The range leading to classification with the largest number of robust archetypes is marked in green. (F) Metaphoric example illustrating the impact of fuzziness on the relevance of partitions and numbers of archetypes. Fuzzy partitions with too few archetypes (large μ, bottom) convey a too blurred image of the dataset. Conversely, fuzzy partitions with too many archetypes (small μ, top) are scarcely representative being strongly affected by outliers. Such issue is graphically represented as impulse noise on the image.
Figure 3
Figure 3
Walking outward from the FS-PV archetype. (A) Tetrahedral representation linking FS-PV (red), Adapting NPY (orange), and Adapting SOM archetypes (green). Individual neurons are depicted as dots in the 3D space of memberships. The X, Y, and Z axes correspond to memberships to the FS-PV, Adapting NPY, and Adapting SOM archetypes, respectively. Vertical stems denoting the projection of selected cells on the bidimensional base plane are introduced as depth clues. (B) Current-clamp recordings of illustrative transition neurons (cells a to o colored in panel A) in response to rheobase current and to a 100 pA hyperpolarizing current pulse (black traces, scale bars 50 mV, 400 ms). Insets: details of the repolarization phase of the first spike (red traces, scale bars 5 mV, 20 ms). (C) Table summarizing 10 electrophysiological and 3 molecular discriminative properties of transition cells between the Adapting NPY, the Adapting SOM, and the FS-PV archetypes. Orange, green, and red backgrounds indicate distinctive values for the Adapting NPY, the Adapting SOM, or the FS-PV archetype, respectively. Gradient backgrounds indicate values falling in a range typical for multiple. Bold colored entries indicate extreme values for an archetypal trend. Thick contours highlight columns corresponding to archetypal cells. Atypical cells display a heterogeneous mixture of property values which are not compatible with a single archetype or which fall in transition ranges.
Figure 4
Figure 4
Walking between Adapting GABAergic archetypes. (A) Tetrahedral representation linking Adapting VIP (blue), Adapting SOM (green), and Adapting NPY (orange) archetypes. Individual neurons are depicted as dots in the 3D space of memberships. The X, Y, and Z axes correspond to memberships to the Adapting VIP, Adapting NPY, and Adapting SOM archetypes, respectively. Vertical stems denoting the projection of selected cells on the bidimensional base plane are introduced as depth clues. (B) Current-clamp recordings of illustrative transition neurons (cells g to r colored in panel A) in response to rheobase current and to a 100 pA hyperpolarizing current pulse (black traces, scale bars 50 mV, 400 ms). Insets: details of the repolarization phase of the first spike (red traces, scale bars 5 mV, 20 ms). (C) Table summarizing 8 electrophysiological and 3 molecular discriminative properties of transitions cells between the Adapting VIP, the Adapting SOM, and the Adapting NPY archetypes. Blue, green, and orange backgrounds indicate distinctive values for the Adapting VIP, the Adapting SOM, or the Adapting NPY archetype, respectively. Gradient backgrounds indicate values falling in a range typical for multiple. Bold colored entries indicate extreme values for an archetypal trend. Thick contours highlight columns corresponding to archetypal cells. Atypical cells display a heterogeneous mixture of property values which are not compatible with a single archetype or which fall in transition ranges.
Figure 5
Figure 5
Visiting the UFOs. (A) Tridimensional representation joining three heterogeneous UFOs. Adapting VIP (blue), Adapting NPY (orange), and UFOs (pink) archetypes. Individual neurons are depicted as dots in a 3D space of memberships. The X, Y, and Z axes correspond to memberships to the Adapting VIP, Adapting NPY, and UFOs archetypes, respectively. Vertical stems denoting the projection of selected cells on the bidimensional base plane are introduced as depth clues. (B) Current-clamp recordings of illustrative transition neurons (cells s to u colored in panel A) in response to rheobase current and to a 100 pA hyperpolarizing current pulse (black traces, scale bars 50 mV, 400 ms). Insets: details of the repolarization phase of the first spike (red traces, scale bars 5 mV, 20 ms). (C) Table summarizing 17 electrophysiological and 5 molecular properties reminiscent of FS-PV (Red), Adapting VIP (blue), Adapting SOM (Green), or Adapting NPY (orange) archetypes in three different UFOs. Colored backgrounds indicate values falling in ranges typical for an archetype. Gradient backgrounds indicate values falling in a range typical for multiple archetypes.
Figure 6
Figure 6
Archetype segregations. (A) Pairwise comparisons of archetype segregations. Two-dimensional projections of memberships of neurons belonging to the Glutamatergic (black), FS-PV (red), Adapting SOM (green), Adapting VIP (blue), Adapting NPY (orange), and UFO (magenta) archetypes. Dashed lines represent identical memberships and gray zones the mean absolute deviation of typicality. Neurons falling within the gray zone correspond to “edge cells.” Note the absence of “edge cells” between, Glutamatergic, FS-PV, and Adapting VIP neurons. (B) Overall distribution of typicality coefficients. The right and left peaks correspond to archetypal and atypical cells, respectively. The grayed background denotes the range of typicalities associated to edge cells. In the stacked histogram, sections with different colors indicate cells with different main type. Archetypal and atypical cells are unequally distributed across archetypes. The bimodal distribution indicates that archetypes tend to separate, but only imperfectly.
Figure 7
Figure 7
Relevance of features for classification. Matching between classifications based on a reduced number of top-ranked properties with the reference classification based on all the 43 features (see Table 7 for relevance ranking of the different properties). Classification matching is analyzed separately for every well-defined archetype and is measured by the fraction of cells with a given main type, matching in both the reference, and a reduced classification. Matching classification fraction for all archetypes confounded is also shown for comparison. Note the order of correctly classified archetypes corresponding to the historically characterized neuronal types.

Similar articles

Cited by

References

    1. Adams R. H., Eichmann A. (2010). Axon guidance molecules in vascular patterning. Cold Spring Harb. Perspect. Biol. 2:a001875 10.1101/cshperspect.a001875 - DOI - PMC - PubMed
    1. Andjelic S., Gallopin T., Cauli B., Hill E. L., Roux L., Badr S., et al. (2009). Glutamatergic nonpyramidal neurons from neocortical layer VI and their comparison with pyramidal and spiny stellate neurons. J. Neurophysiol. 101, 641–654 10.1152/jn.91094.2008 - DOI - PMC - PubMed
    1. Ascoli G. A., Alonso-Nanclares L., Anderson S. A., Barrionuevo G., Benavides-Piccione R., Burkhalter A., et al. (2008). Petilla Terminology, Nomenclature of features of GABAergic interneurons of the cerebral cortex. Nat. Rev. Neurosci. 9, 557–568 10.1038/nrn2402 - DOI - PMC - PubMed
    1. Attwell D., Buchan A. M., Charpak S., Lauritzen M., MacVicar B. A., Newman E. A. (2010). Glial and neuronal control of brain blood flow. Nature 468, 232–243 10.1038/nature09613 - DOI - PMC - PubMed
    1. Basu S., Banerjee A., Mooney R. J. (2002). Semi-supervised clustering by seeding, in Proceedings of the Nineteenth International Conference on Machine Learning, eds Sammut C., Hoffmann A. G. (San Francisco, CA: Morgan Kaufmann; ), 27–34

Publication types

LinkOut - more resources