. 2013 Feb 8:3:316.
doi: 10.3389/fgene.2012.00316. eCollection 2012.

Genome-Wide Functional and Stress Response Profiling Reveals Toxic Mechanism and Genes Required for Tolerance to Benzo[a]pyrene in S. cerevisiae

Affiliations

Genome-Wide Functional and Stress Response Profiling Reveals Toxic Mechanism and Genes Required for Tolerance to Benzo[a]pyrene in S. cerevisiae

Sean Timothy Francis O'Connor et al. Front Genet. .

Abstract

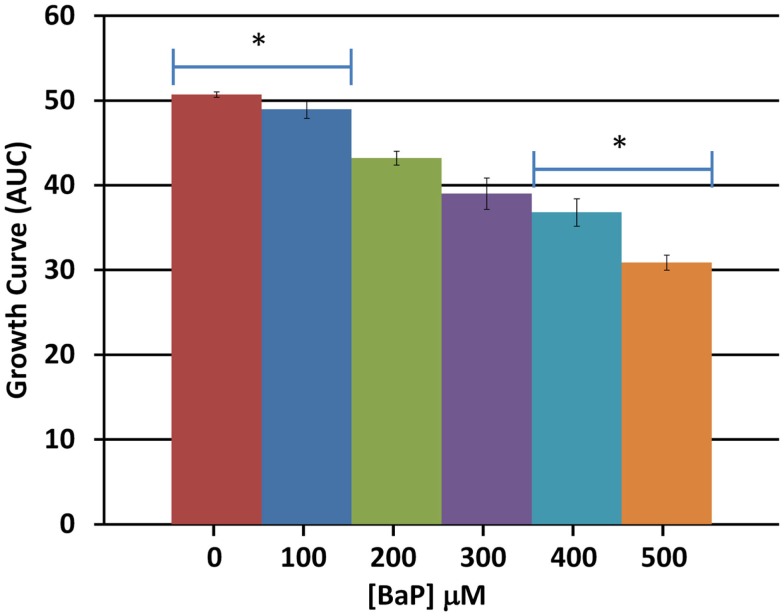
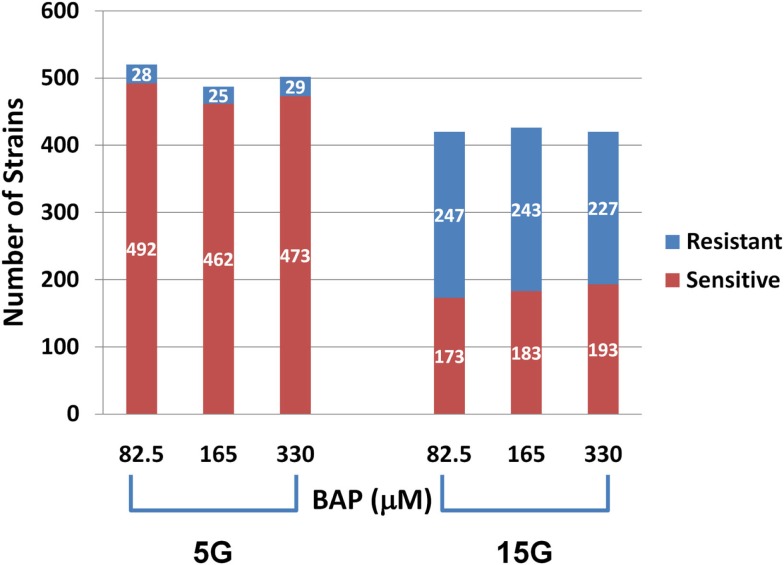
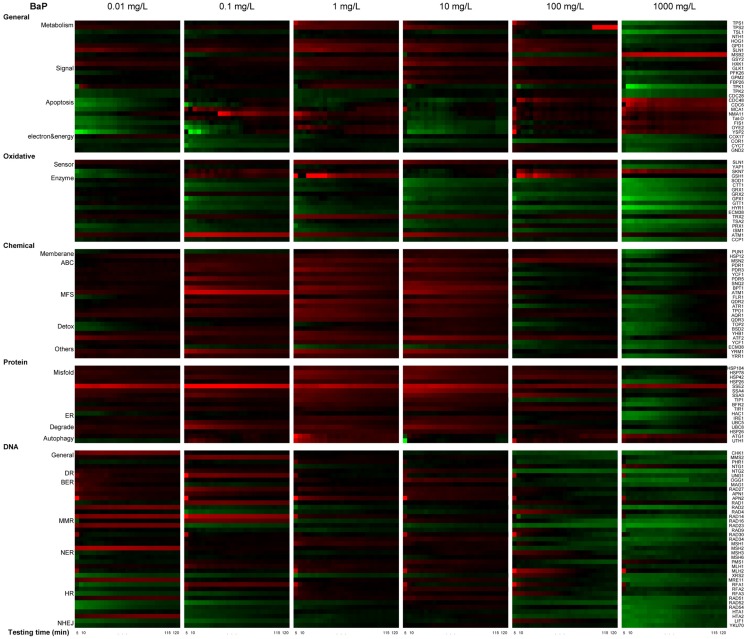
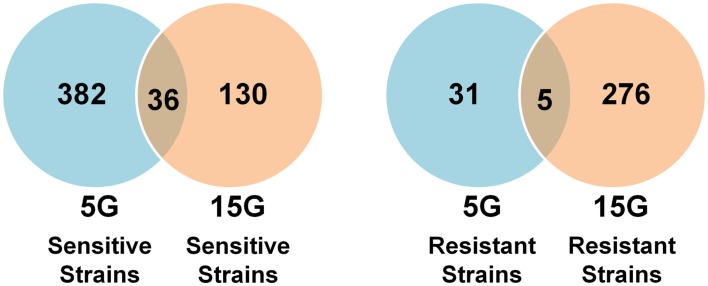
Benzo[a]pyrene (BaP) is a ubiquitous, potent, and complete carcinogen resulting from incomplete organic combustion. BaP can form DNA adducts but other mechanisms may play a role in toxicity. We used a functional toxicology approach in S. cerevisiae to assess the genetic requirements for cellular resistance to BaP. In addition, we examined translational activities of key genes involved in various stress response pathways. We identified multiple genes and processes involved in modulating BaP toxicity in yeast which support DNA damage as a primary mechanism of toxicity, but also identify other potential toxicity pathways. Gene ontology enrichment analysis indicated that DNA damage and repair as well as redox homeostasis and oxidative stress are key processes in cellular response to BaP suggesting a similar mode of action of BaP in yeast and mammals. Interestingly, toxicant export is also implicated as a potential novel modulator of cellular susceptibility. In particular, we identified several transporters with human orthologs (solute carrier family 22) which may play a role in mammalian systems.

Keywords: S-9; benzo[a]pyrene; ontology; resistance; sensitivity; stress; toxicity; yeast.


Figures

Figure 1
Figure 1
Average total cell growth. Average total cell growth over the 24 h period was obtained by calculating the area under the curve (AUC) for each dose and averaging the result across three biological replicates. Bars are standard errors of three biological replicates; significance by t-test comparison between each two doses sequentially; *represents p < 0.05.
Figure 2
Figure 2
Number of sensitive and resistant yeast deletion strains for each exposure at three BaP concentrations and for five (5G) and 15 (15G) generations.
Figure 3
Figure 3
Venn diagrams of the amount and overlap of sensitive/resistant strains observed across overall exposure duration categories (A) and for each dose group (B).
Figure 4
Figure 4
Wild type yeast exposure to various combinations of BaP and S-9 concentrations. *Indicates significance at 0.01 < p < 0.05, **indicates significance at p < 0.01. Bars are standard errors of three biological replicates.
Figure 5
Figure 5
Real-time protein expression profile of BaP exposure based on natural log of induction factor. ln I as average of triplicate, Red spectrum colors indicate upregulation, green spectrum colors indicate downregulation in yeast. X-axis bottom: testing time, every 5 min for 2 h. Y-axis left: clusters of proteins by stress response pathways, Y-axis right: ORFs tested.
Figure 6
Figure 6
Enrichment analysis of protein expression according to various stress groups for different concentrations of BaP exposure. For each concentration, the ORFs are ranked in decreasing order by their PELI score (PELIORF, average of triplicates). Different colors indicate different stress groups (see Table 1).
Figure 7
Figure 7
Venn diagram overlap between sensitive and resistant strains across generations.
Figure A1
Figure A1
Growth curve assay for BY4743 wild type S. cerevisiae exposed to increasing concentrations of BAP in YPD liquid media. Optical density at 595 nm was measured every 15 min for a period of 24 h; each point in the curve represents a mean of three replicates. Standard error is omitted for clarity.
Figure A2
Figure A2
BAP Dose-response curve. Each “bp” green x mark is a point estimate of three biological replicate exposures at five concentrations: 100, 200, 300, 400, and 500 μm. The dotted line represents 95% confidence interval to the fitted line. See Figure A1 for growth curves and total growth data for each of the five doses.
Figure A3
Figure A3
Confirmation of inhibition of selected yeast strains exposed individually to BAP. *Represents significance at 0.01<p<0.05; **represents significance at p<0.01. Bars are standard errors.

Similar articles

Cited by

References

    1. Alexander K. T. W., Mitropoulos K. A., Gibbons G. F. (1974). A possible role for cytochrome P-450 during the biosynthesis of zymosterol from lanosterol by Saccharomyces cerevisiae. Biochem. Biophys. Res. Commun. 60, 460–46710.1083/jcb.60.2.460 - DOI - PubMed
    1. Andreau K., Melanie L., Aida B. (2012). Health and cellular impact of air pollutants: from cytoprotection to cytotoxicity. Biochem. Res. Int. 2012, 1–1810.1155/2012/398697 - DOI - PMC - PubMed
    1. Aoyama Y., Yoshida Y. (1978). Interaction of lanosterol to cytochrome P-450 purified from yeast microsomes: evidence for contribution of cytochrome P-450 to lanosterol metabolism. Biochem. Biophys. Res. Commun. 82, 33–3810.1016/0006-291X(78)90572-7 - DOI - PubMed
    1. Ashburner M., Ball C. A., Blake J. A., Botstein D., Butler H., Cherry J. M., et al. (2000). Gene ontology: tool for the unification of biology. The gene ontology consortium. Nat. Genet. 25, 25–2910.1038/75556 - DOI - PMC - PubMed
    1. Aust A. E., Falahee K. J., Maher V. M., McCormick J. J. (1980). Human cell-mediated benzo(a)pyrene cytotoxicity and mutagenicity in human diploid fibroblasts. Cancer Res. 40, 4070–4075 - PubMed

LinkOut - more resources