. 2013 Apr 1;304(7):E711-23.
doi: 10.1152/ajpendo.00304.2012. Epub 2013 Feb 12.

Characterization of β-cell plasticity mechanisms induced in mice by a transient source of exogenous insulin

Affiliations

Characterization of β-cell plasticity mechanisms induced in mice by a transient source of exogenous insulin

M-C Nollevaux et al. Am J Physiol Endocrinol Metab. .

Abstract

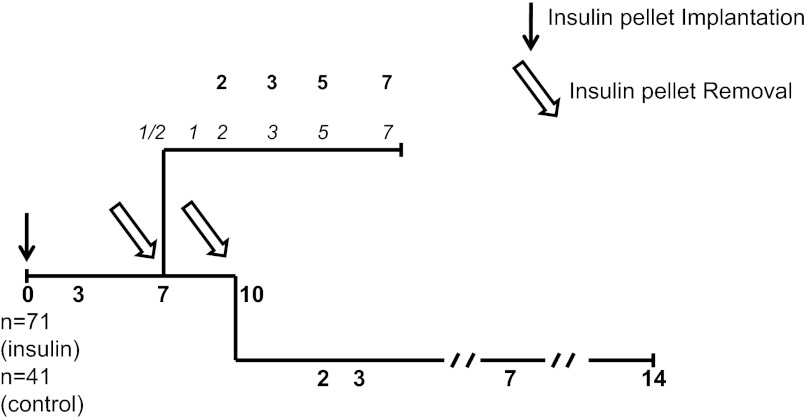
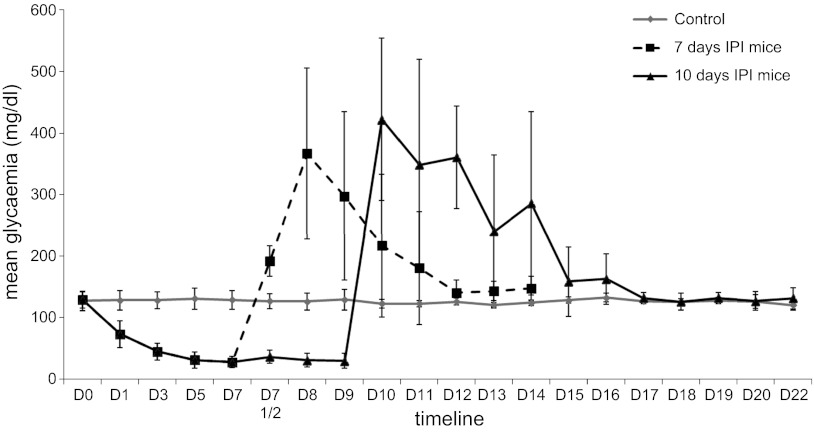
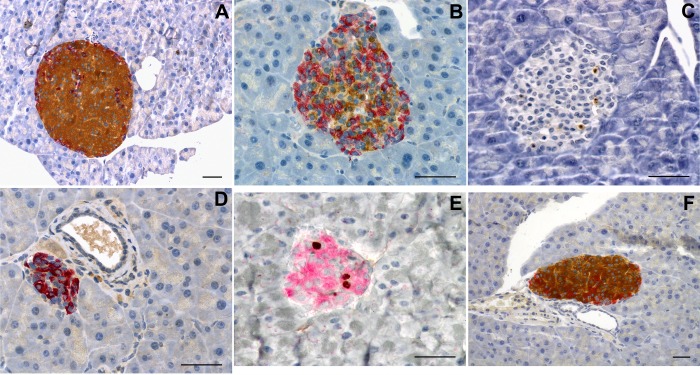
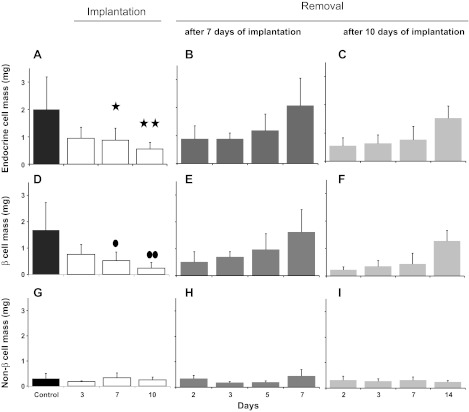
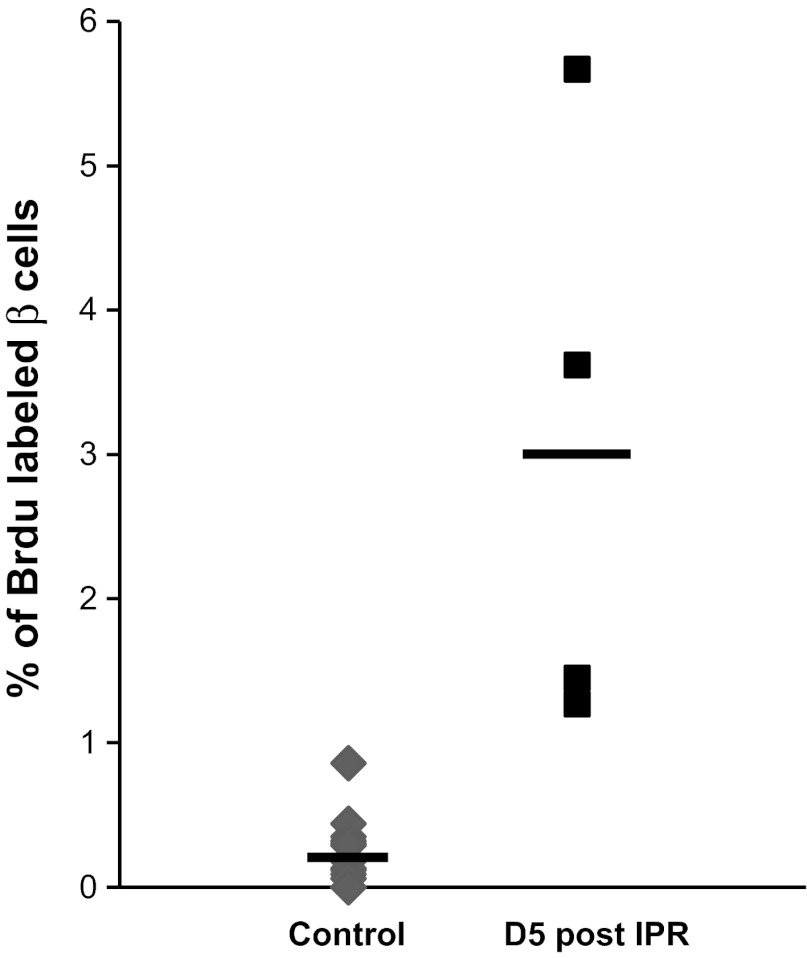
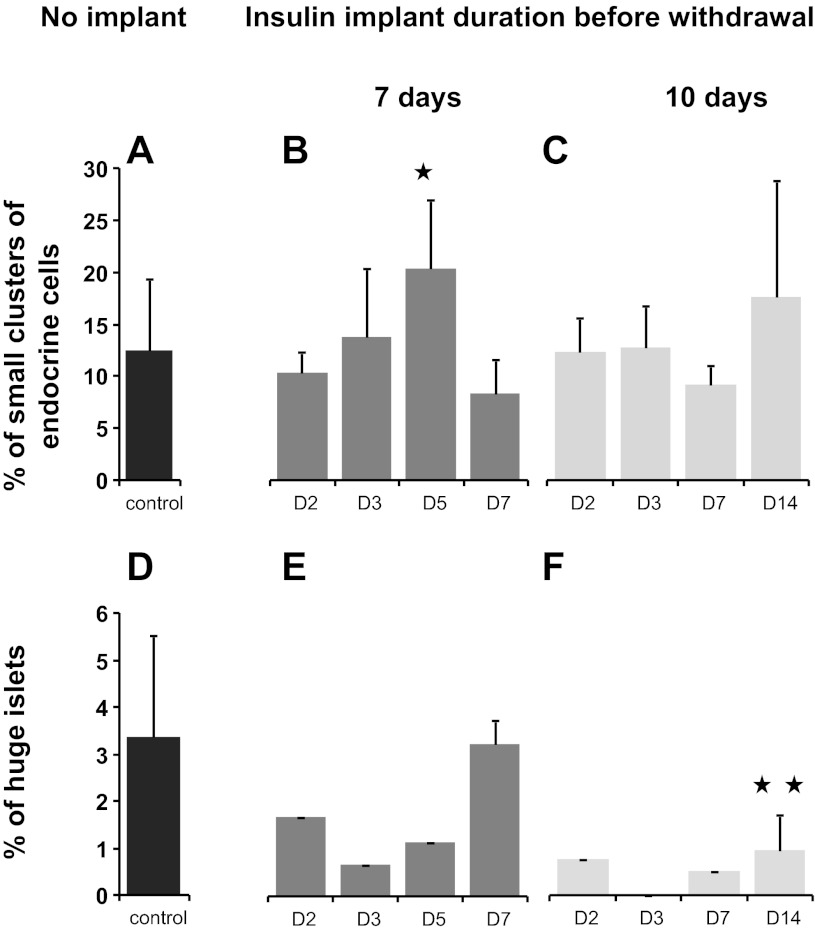
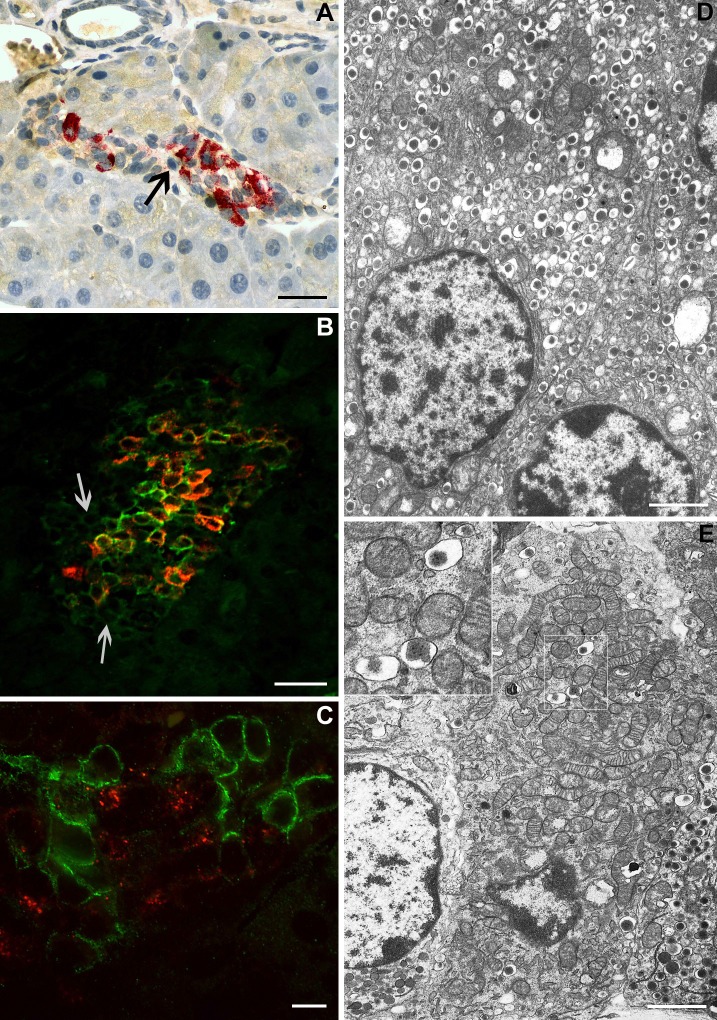
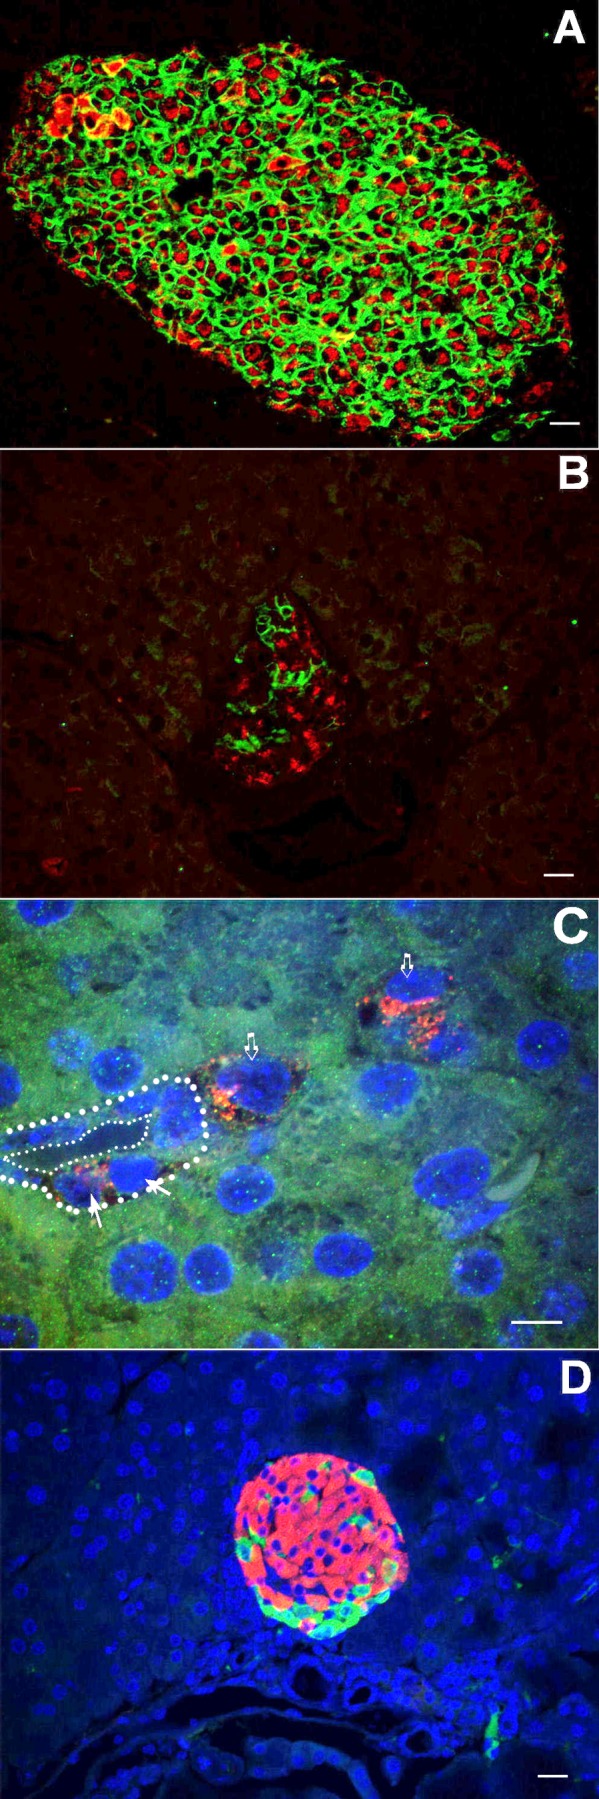
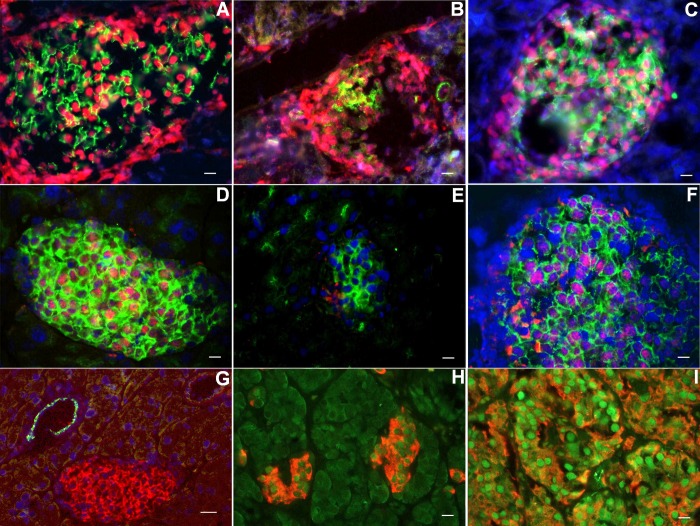
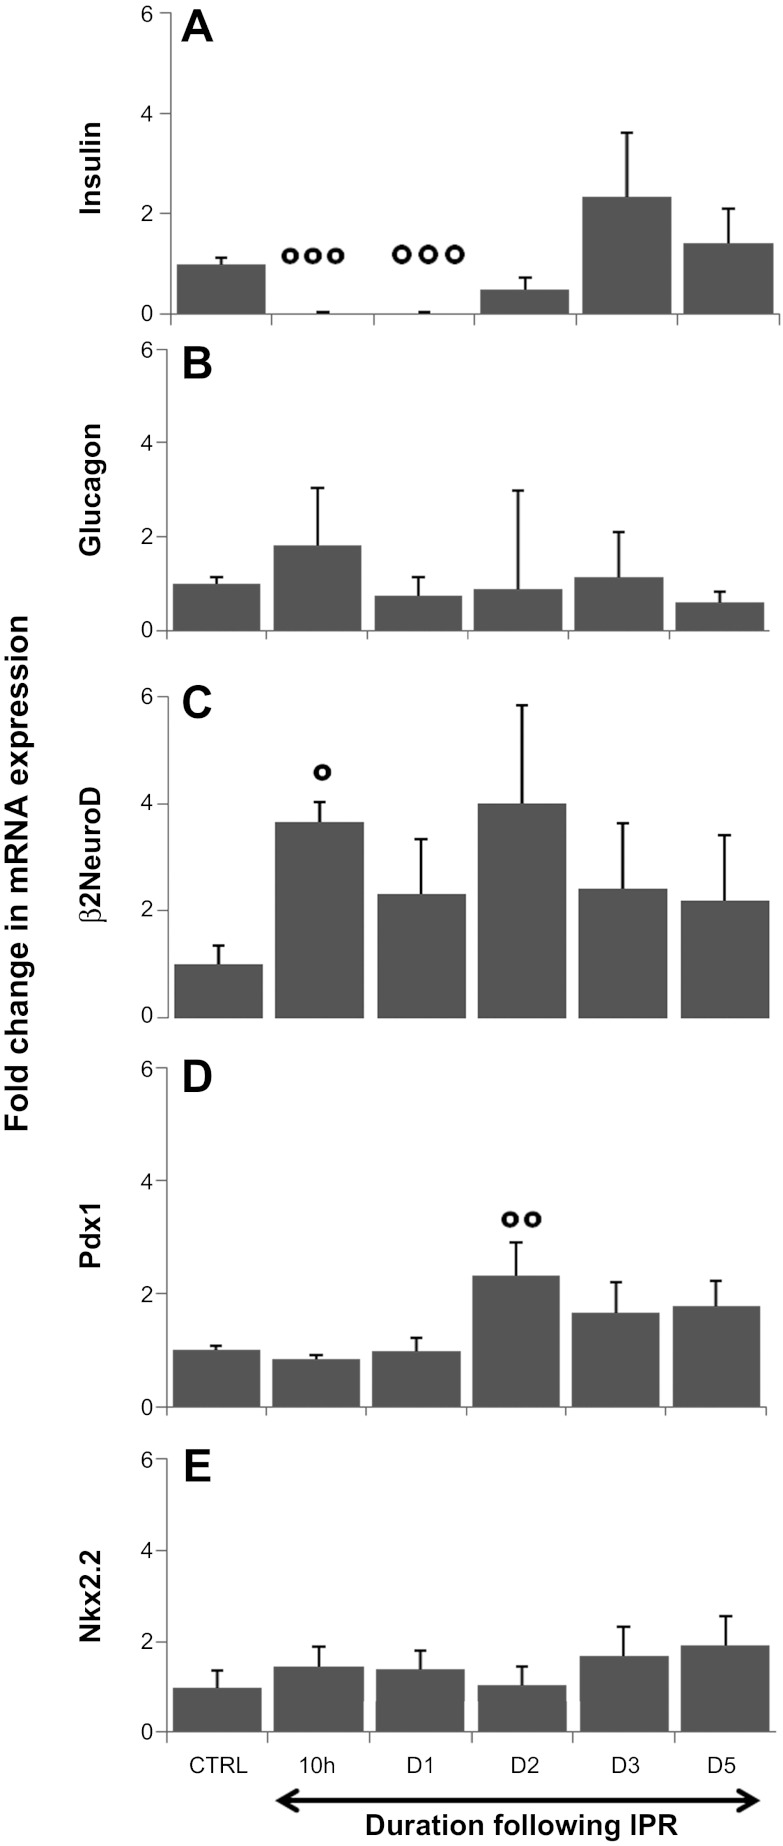
β-Cell plasticity governs the adjustment of β-cell mass and function to ensure normoglycemia. The study of how β-cell mass is controlled and the identification of alternative sources of β-cells are active fields of research. β-Cell plasticity has been implicated in numerous physiological and pathological conditions. We developed a mice model in which we induced major β-cell mass atrophy by implanting insulin pellets (IPI) for 7 or 10 days. The implants were then removed (IPR) to observe the timing and characteristics of β-cell regeneration in parallel to changes in glycemia. Following IPR, the endocrine mass was reduced by 60% at day 7 and by 75% at day 10, and transient hyperglycemia was observed, which resolved within 1 wk. Five days after IPR, enhanced β-cell proliferation and an increased frequency of small islets were observed in 7-day IPI mice. β-Cell mass was fully restored after an additional 2 days. For the 10-day IPI group, β-cell and endocrine mass were no longer significantly different from those of the control group at 2 wk post-IPR. Furthermore, real-time quantitative PCR analysis of endocrine structures isolated by laser capture microdissection indicated sequentially enhanced expression of the pancreatic transcription factors β(2)/NeuroD and Pdx-1 post-IPR. Thus, our data suggest this mouse model of β-cell plasticity not only relies on replication but also involves enhanced cell differentiation plasticity.


Figures

Fig. 1.
Fig. 1.
Experimental design for the implantation of insulin pellets at day 0 and their removal at day 7 or day 10 postimplantation. Bold nos. along the timeline correspond to days of death for morphometry analysis. Italic nos. along the timeline correspond to days of death for molecular analysis.
Fig. 2.
Fig. 2.
Evolution of glycemia during the experiment. IPI, insulin pellet implant; D, day.
Fig. 3.
Fig. 3.
Morphology of the islets of Langerhans. On day 3 post-IPI (A), islet morphology was normal, whereas at 7 days post-IPI (B), the proportion of β-cells was reduced. In Situ Apoptosis Detection Kit revealed apoptosis in day-7 IPI mice (brown deposit, C). At day 10, islets of Langerhans appeared almost devoid of insulin-producing cells (D). β-Cell proliferation peaked 5 days following insulin pellet removal (IPR) in 7-day IPI mice (E), and normal proportions of endocrine cells were restored (F). A, B, D, and F: immunohistochemical staining with insulin is shown in brown, and staining with the glucagon-somatostatin cocktail is shown in red. C: In Situ Apoptosis Detection Kit (Takara) to detect apoptotic cells. E: nuclear immunohistochemical staining with 5-bromo-2′-deoxyuridine (BrdU) is shown in brown, and insulin staining is shown in red. Scale bars = 50 μm.
Fig. 4.
Fig. 4.
Endocrine (AC), β-cell (DE), and non-β-cell (GI) masses. A: the endocrine mass had began to decrease at day 3 and was reduced by 60% at day 7 and 75% at day 10. Similarly, a profound drop in β-cell mass (D) was observed at day 7 and day 10 in animals implanted with insulin pellets. Seven days following the withdrawal of the implants, both endocrine mass (B) and β-cell mass (E) were restored. In mice that had received insulin for 10 days, the endocrine mass (C) and the β-cell mass (F) were not restored until 14 days post-IPR. The non-β-cell mass remained unchanged throughout the experimental procedure (GI). P = 0.048 (A), P = 0.015 (D), ✱✱P = 0.008 (A) and ●●P = 0.002 (D).
Fig. 5.
Fig. 5.
A peak in β-cell proliferation occurred 5 days after IPR (P = 0.030) before values returned to normal 2 days later. The straight bars indicate the means.
Fig. 6.
Fig. 6.
Distribution of islet profiles. Small clusters (AC): a drastic increase in small clusters was observed 5 days after IPR in 7-day IPI mice (P = 0.041; B). For the 10-days IPI mice, the no. of small endocrine cell clusters also increased 14 days post-IPR, but the value did not reach significance at that time. Large islets (DF): in the initial days after IPR, the proportion of these islets was lower than that observed in controls (D). In 7-day IPI mice, the proportion of these very large islets had returned to normal by 7 days post-IPR (E), whereas in 10-day IPI mice, the number of large islets remained fewer at 7 and 14 days after IPR than that observed in the control group (D) (P = 0.015; F). P = 0.041 and ✱✱P = 0.003.
Fig. 7.
Fig. 7.
Islet cells without any immunostaining in 10-days IPI mice. In day 10 IPI mice, cells remained unstained, either with anti-insulin antibody or glucagon or somatostatin antibodies (arrow) in islets (A). Coimmunofluorescent labeling with insulin (red) and glucose transporter-2 (GLUT-2, green) showed the absence of insulin expression in islet cells with weak expression of GLUT-2 (arrows) (B). Colabeling for proinsulin (red) and GLUT-2 (green) in mice before pellet removal revealed cells expressing proinsulin but not GLUT-2 and inversely (C). Electron microscopy revealed a drastic decrease in the no. of insulin-secreting granules in some cells (E). Inset: characteristic insulin granules (dense core and clear halo). In control mice, β-cells contain numerous insulin granules (D). Scale bar for A and B = 50 μm; for C = 10 μm; and for D and E = 2.6 μm.
Fig. 8.
Fig. 8.
Immunolocalization of proinsulin and GLUT-2 (AC); immunolocalization of insulin and glucagon (D). Control mice show a characteristic coexpression of GLUT-2 (green) and proinsulin (red) (A), whereas, in 10-days IPI mice, GLUT-2 expression is heterogenous (B): some cells expressing proinsulin are devoid of GLUT-2 staining (GLUT-2 revealed in green; proinsulin revealed in red). Two days after IPR, in 10-days IPI mice, cells expressing proinsulin (red), in the absence of GLUT-2, were observed in close vicinity of a duct (C). Colocalization of glucagon (green) and insulin (red) was never observed here, 5 days after IPR, in 7-days IPI mice (D). Scale bar for A, B, and D: 20 μm; and for C: 10 μm. Solid arrows indicate cells expressing proinsulin (red) in the absence of GLUT-2 located in the close vicinity of a duct. Open arrows indicate isolated cells expressing proinsulin (red) in the absence of GLUT-2 within the exocrine parenchyma.
Fig. 9.
Fig. 9.
Cellular localization of transcription factors. In control pancreas, GLUT-2 expression was restricted to β-cell with an almost exclusive membranous pattern (green staining; A and D). No significant modification in the expression pattern of Nkx2.2 (nuclear red staining) was observed after IPR (B and C). At day 3 post-IPR in 7-days IPI mice, nuclear expression of Pdx-1 (nuclear red staining) (F) in GLUT-2-positive cells (green) became evident, whereas almost no staining could be detected the days before (E) in cells expressing GLUT-2. In the focal form of persistent hyperinsulinemic hypoglycemia of infancy, expression of Pdx-1 (nuclear green) is more pronounced in adenomatous islets (I) than in islets outside of tumor (H) (insulin in red; H and I). In control pancreas as in IPR mice, cytokeratin 19 expression (green) was only observed in ducts, without any colocalization with GLUT-2 (red)-positive islet cells (G). Scale bar for AF and HI: 20 μm; scale bar for G: 40 μm.
Fig. 10.
Fig. 10.
Fold change in transcription factor mRNA expression following IPR. mRNA levels of insulin, glucagon, β2/NeuroD, Pdx-1, and Nkx2.2 were measured by real-time PCR. The relative changes in expression levels at each time point relative to the controls were calculated using the 2 − (δδCt) method. The level of insulin mRNA expression (A) remained low during the initial days post-IPR (98% lower than in controls; P < 0.001 at 10 h and 1 day post-IPR), but, at 3 days post-IPR, the expression of the insulin gene tended to be elevated (2.3× the control value) but subsequently returned to baseline. The expression of glucagon mRNA (B) remained stable throughout the experiment. Precociously enhanced expression of β2NeuroD (C) was observed 10 h after retrieval, compared with the controls, and its expression remained elevated afterward. Pdx-1 mRNA expression (D) was increased 2.3-fold compared with the controls at 2 days post-IPR. The level of Nkx2.2 mRNA expression (E) was increased by almost 2-fold compared with the controls at 5 days post-IPR, without statistical significance. The data are presented as the median logarithms of numerical results. °°°P < 0.001 (A), °P = 0.013 (C), and °°P = 0.012 (D) at day 3.

Similar articles

Cited by

References

    1. Bonner-Weir S. Islet growth and development in the adult. J Mol Endocrinol 24: 297–302, 2000 - PubMed
    1. Bonner-Weir S, Deery D, Leahy JL, Weir GC. Compensatory growth of pancreatic beta-cells in adult rats after short-term glucose infusion. Diabetes 38: 49–53, 1989 - PubMed
    1. Bonner-Weir S, Trent DF, Weir GC. Partial pancreatectomy in the rat and subsequent defect in glucose-induced insulin release. J Clin Invest 71: 1544–1553, 1983 - PMC - PubMed
    1. Bouwens L, Rooman I. Regulation of pancreatic beta-cell mass. Physiol Rev 85: 1255–1270, 2005 - PubMed
    1. Butler AE, Cao-Minh L, Galasso R, Rizza RA, Corradin A, Cobelli C, Butler PC. Adaptive changes in pancreatic beta cell fractional area and beta cell turnover in human pregnancy. Diabetologia 53: 2167–2176, 2010 - PMC - PubMed

Publication types

MeSH terms

LinkOut - more resources