. 2013 Feb 12;4(1):e00623-12.
doi: 10.1128/mBio.00623-12.

A decade of plague in Mahajanga, Madagascar: insights into the global maritime spread of pandemic plague

Affiliations

A decade of plague in Mahajanga, Madagascar: insights into the global maritime spread of pandemic plague

Amy J Vogler et al. mBio. .

Abstract

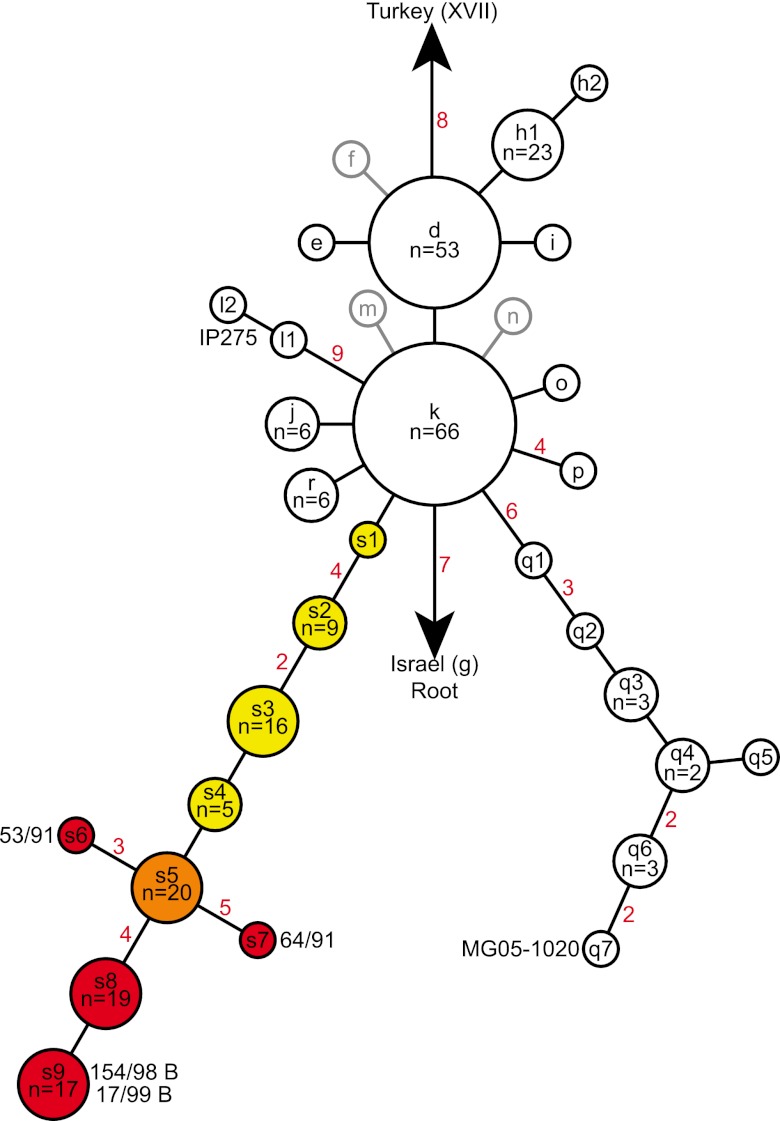
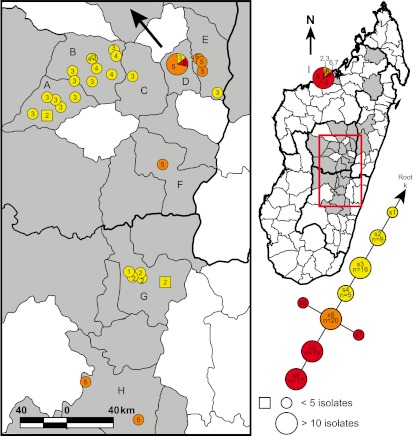
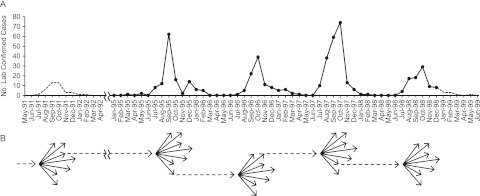
A cluster of human plague cases occurred in the seaport city of Mahajanga, Madagascar, from 1991 to 1999 following 62 years with no evidence of plague, which offered insights into plague pathogen dynamics in an urban environment. We analyzed a set of 44 Mahajanga isolates from this 9-year outbreak, as well as an additional 218 Malagasy isolates from the highland foci. We sequenced the genomes of four Mahajanga strains, performed whole-genome sequence single-nucleotide polymorphism (SNP) discovery on those strains, screened the discovered SNPs, and performed a high-resolution 43-locus multilocus variable-number tandem-repeat analysis of the isolate panel. Twenty-two new SNPs were identified and defined a new phylogenetic lineage among the Malagasy isolates. Phylogeographic analysis suggests that the Mahajanga lineage likely originated in the Ambositra district in the highlands, spread throughout the northern central highlands, and was then introduced into and became transiently established in Mahajanga. Although multiple transfers between the central highlands and Mahajanga occurred, there was a locally differentiating and dominant subpopulation that was primarily responsible for the 1991-to-1999 Mahajanga outbreaks. Phylotemporal analysis of this Mahajanga subpopulation revealed a cycling pattern of diversity generation and loss that occurred during and after each outbreak. This pattern is consistent with severe interseasonal genetic bottlenecks along with large seasonal population expansions. The ultimate extinction of plague pathogens in Mahajanga suggests that, in this environment, the plague pathogen niche is tenuous at best. However, the temporary large pathogen population expansion provides the means for plague pathogens to disperse and become ecologically established in more suitable nonurban environments.

Importance: Maritime spread of plague led to the global dissemination of this disease and affected the course of human history. Multiple historical plague waves resulted in massive human mortalities in three classical plague pandemics: Justinian (6th and 7th centuries), Middle Ages (14th to 17th centuries), and third (mid-1800s to the present). Key to these events was the pathogen's entry into new lands by "plague ships" via seaport cities. Although initial disease outbreaks in ports were common, they were almost never sustained for long and plague pathogens survived only if they could become established in ecologically suitable habitats. Although plague pathogens' ability to invade port cities has been essential for intercontinental spread, these regions have not proven to be a suitable long-term niche. The disease dynamics in port cities such as Mahajanga are thus critical to plague pathogen amplification and dispersal into new suitable ecological niches for the observed global long-term maintenance of plague pathogens.


Figures

FIG 1
FIG 1
SNP phylogeny of 262 Malagasy Y. pestis isolates. Nodes (lowercase letters) were named as in reference and include all of the nodes described there and a new lineage containing nine nodes (s1 to s9) described here. Black and gray outlines indicate previously identified nodes (2, 15) that were and were not, respectively, represented by isolates in this study. The nine new nodes are colored to indicate which nodes were found predominantly in the central highlands (yellow), the node that was likely introduced into Mahajanga from the central highlands (orange), and which nodes were likely derived in Mahajanga (red). The numbers of isolates in nodes with more than one isolate are indicated as are the numbers of SNPs on branches (red numbers) with more than one SNP. The nodes containing the sequenced Mahajanga strains (53/91, 64/91, 154/98 B, and 17/99 B) and the two previously sequenced Malagasy strains (MG05-1020 and IP275) are labeled with the strain names.
FIG 2
FIG 2
Geographic distribution of nodes s1 to s9. The s lineage portion of the SNP phylogeny from Fig. 1 is shown, as well as a map of Madagascar indicating the geographic distribution of isolates from this lineage. Light-gray-shaded polygons indicate Madagascar districts where Y. pestis isolates used in this study were obtained. Districts where isolates from the s lineage were found are labeled by letters as follows: A, Soavinandriana; B, Miarinarivo; C, Arivonimamo; D, Antananarivo; E, Manjakandriana; F, Antanifotsy; G, Ambositra; H, Fianarantsoa; I, Mahajanga. Colors within the mapped circles and squares correspond to the node color designations in the SNP phylogeny. Divisions within circles indicate that multiple nodes were found at that location. Circles represent isolates where the city or commune of origin is known. Squares represent isolates where only the district of origin is known and are placed within their corresponding districts near cities or communes containing the same node(s) where possible. Circles, squares, and pie chart slices in the map are numbered on the basis of the node number in the SNP phylogeny for the isolates represented by those shapes. A large arrow indicates the likely geographic source and direction of travel of the Y. pestis strain that was introduced into and became established in Mahajanga.
FIG 3
FIG 3
Maximum-likelihood phylogeny of Mahajanga Y. pestis isolates. A maximum-likelihood phylogeny based upon MLVA data is presented for 39 Y. pestis isolates believed to have originated from local cycling in Mahajanga. Numbered circles indicate MLVA genotypes. Genotype circles are color coded by the year of isolation and sized according to the number of isolates with each genotype. An asterisk marks the genotype circles containing each of the four Mahajanga strains sequenced. Small black circles indicate theoretical intermediate MLVA genotypes that were not observed in our isolate set. Red brackets or bars indicate the locations of SNP mutations and are labeled with the number of SNPs and the SNP ID numbers presented in Table S1 in the supplemental material; the brackets span the entire branch linking two SNP-defined nodes to reflect the fact that the exact order of these SNP mutations among the theoretical intermediate genotypes depicted is unknown. The corresponding SNP nodes from Fig. 1 are indicated by light-gray-shaded areas labeled with the name of that node in red. Dark gray arrows pointing to a “CH” and a year indicate those points along the Mahajanga phylogeny where isolates appear to have been transferred to the central highlands; the years of isolation of the central-highland isolate are shown. Boxed letters indicate individual VNTR mutations. Assuming a root at genotype 1 and moving from left to right, these mutations were as follows, where a plus or minus sign indicates an insertion or deletion, respectively, followed by the number of repeats involved in the mutation: a, q, r, u, v, and gg, M19 + 1; b, M22 + 2; c, M19 + 2; d, f, s, and aa, M27 − 1; e and j, M19 − 2; g, M19 − 6; h and bb, M22 − 1; i, m, and dd, M23 + 1; k and n, M12 − 1; l and p, M25 − 1; o, M19 − 1; t, M58 + 1; w, M25 + 2; x, M28 + 1; y, M79 + 1; z, M25 + 1; cc, M31 − 1; ee, M27 + 1; ff, M12 − 2; hh, M28 − 1. Note that the ordering of VNTR mutations and theoretical genotypes along those branches with multiple VNTR mutations is arbitrary, as the exact order of the VNTR mutations is unknown.
FIG 4
FIG 4
Schematic of the Mahajanga outbreaks. (A) Graph of the number of laboratory-confirmed human plague cases in Mahajanga from May 1991 through June 1999. Solid lines and points indicate actual numbers of confirmed and presumptive human plague cases derived from reference . Dotted lines represent the estimated numbers of confirmed and presumptive human plague cases on the basis of either the average percentage of cases per month observed from 1995 to 1998 multiplied by the total number of laboratory-confirmed cases reported for the 1991-1992 outbreak (11) for May 1991 through April 1992 or the average number of cases per month observed from 1995 to 1998 for January 1999 through June 1999. (B) Schematic of the expansions and contractions that occurred in the Y. pestis subpopulation in Mahajanga during the 1991-to-1999 outbreaks. Each dotted arrow represents the founding genotype of an outbreak, and each arrow cluster indicates the population expansion and the corresponding increase in genetic diversity that occurred during each outbreak. As Y. pestis was apparently eliminated from Mahajanga following the 1998-1999 outbreak, no dotted arrow leads from that arrow cluster.

References

    1. Achtman M, Morelli G, Zhu P, Wirth T, Diehl I, Kusecek B, Vogler AJ, Wagner DM, Allender CJ, Easterday WR, Chenal-Francisque V, Worsham P, Thomson NR, Parkhill J, Lindler LE, Carniel E, Keim P. 2004. Microevolution and history of the plague bacillus, Yersinia pestis. Proc. Natl. Acad. Sci. U. S. A. 101:17837–17842 - PMC - PubMed
    1. Morelli G, Song Y, Mazzoni CJ, Eppinger M, Roumagnac P, Wagner DM, Feldkamp M, Kusecek B, Vogler AJ, Li Y, Cui Y, Thomson NR, Jombart T, Leblois R, Lichtner P, Rahalison L, Petersen JM, Balloux F, Keim P, Wirth T, Ravel J, Yang R, Carniel E, Achtman M. 2010. Yersinia pestis genome sequencing identifies patterns of global phylogenetic diversity. Nat. Genet. 42:1140–1143 - PMC - PubMed
    1. Cui Y, Yu C, Yan Y, Li D, Li Y, Jombart T, Weinert LA, Wang Z, Guo Z, Xu L, Zhang Y, Zheng H, Qin N, Xiao X, Wu M, Wang X, Zhou D, Qi Z, Du Z, Wu H, Yang X, Cao H, Wang H, Wang J, Yao S, Rakin A, Li Y, Falush D, Balloux F, Achtman M, Song Y, Wang J, Yang R. 2013. Historical variations in mutation rate in an epidemic pathogen, Yersinia pestis. Proc. Natl. Acad. Sci. U. S. A. 110:577–582 - PMC - PubMed
    1. Perry RD, Fetherston JD. 1997. Yersinia pestis—etiologic agent of plague. Clin. Microbiol. Rev. 10:35–66 - PMC - PubMed
    1. Brygoo ER. 1966. Epidémiologie de la peste à Madagascar. Arch. Inst. Pasteur Madagascar 35:9–147

Publication types

MeSH terms

LinkOut - more resources