. 2013 Mar 22;288(12):8299-8312.
doi: 10.1074/jbc.M112.426536. Epub 2013 Feb 12.

Sodium phenylbutyrate enhances astrocytic neurotrophin synthesis via protein kinase C (PKC)-mediated activation of cAMP-response element-binding protein (CREB): implications for Alzheimer disease therapy

Affiliations

Sodium phenylbutyrate enhances astrocytic neurotrophin synthesis via protein kinase C (PKC)-mediated activation of cAMP-response element-binding protein (CREB): implications for Alzheimer disease therapy

Grant T Corbett et al. J Biol Chem. .

Abstract

Neurotrophins, such as brain-derived neurotrophic factor (BDNF) and neurotrophin-3 (NT-3), are believed to be genuine molecular mediators of neuronal growth and homeostatic synapse activity. However, levels of these neurotrophic factors decrease in different brain regions of patients with Alzheimer disease (AD). Induction of astrocytic neurotrophin synthesis is a poorly understood phenomenon but represents a plausible therapeutic target because neuronal neurotrophin production is aberrant in AD and other neurodegenerative diseases. Here, we delineate that sodium phenylbutyrate (NaPB), a Food and Drug Administration-approved oral medication for hyperammonemia, induces astrocytic BDNF and NT-3 expression via the protein kinase C (PKC)-cAMP-response element-binding protein (CREB) pathway. NaPB treatment increased the direct association between PKC and CREB followed by phosphorylation of CREB (Ser(133)) and induction of DNA binding and transcriptional activation of CREB. Up-regulation of markers for synaptic function and plasticity in cultured hippocampal neurons by NaPB-treated astroglial supernatants and its abrogation by anti-TrkB blocking antibody suggest that NaPB-induced astroglial neurotrophins are functionally active. Moreover, oral administration of NaPB increased the levels of BDNF and NT-3 in the CNS and improved spatial learning and memory in a mouse model of AD. Our results highlight a novel neurotrophic property of NaPB that may be used to augment neurotrophins in the CNS and improve synaptic function in disease states such as AD.


Figures

FIGURE 1.
FIGURE 1.
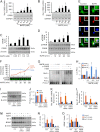
Time- and dose-dependent induction of BDNF and NT-3 mRNAs in primary mouse astrocytes by NaPB. Cultured astrocytes were immunostained with GFAP (green) and MAP-2 (A; red) or Iba-1 (B; red) to determine purity. Cells were stimulated with different doses of NaPB for 6 h and analyzed for BDNF (blue) and NT-3 (orange) mRNAs by semiquantitative RT-PCR (C) and qPCR (D). Time-dependent responses of BDNF (blue) and NT-3 (orange) mRNA to 0.2 mm NaPB were monitored by RT-PCR (E) and qPCR (F). Results represent three independent experiments. Data (mean plus S.D. (error bars)) were analyzed for statistical significance by one-way ANOVA (*, p < 0.01; **, p < 0.001). Scale bar, 50 μm. MRGD, merged image.
FIGURE 2.
FIGURE 2.
NaPB up-regulates BDNF and NT-3 in primary mouse and human astrocytes. A, NaPB dose-dependently induces BDNF and NT-3 release. Supernatants from primary mouse astrocytes stimulated with various concentrations of NaPB or 0.2 mm NaFO for 24 h (A) were analyzed for BDNF (blue) and NT-3 (orange) expression via ELISA. B, NaPB time-dependently induces BDNF and NT-3 release. Supernatants from mouse astrocytes stimulated with 0.2 mm NaPB for various time points (B) were analyzed for BDNF (blue) and NT-3 (orange) expression via ELISA. C and D, NaPB elevates cell-bound BDNF. Primary mouse cortical (E) and primary human astrocytes (F) stimulated with 0.2 mm NaPB, NaPA, or NaFO for 24 h were immunostained for BDNF (red), GFAP (green), and DAPI (blue). E and F, NaPB elevates cell-bound NT-3. Primary mouse cortical (G) and primary human astrocytes (H) stimulated with 0.2 mm NaPB, NaPA, or NaFO for 24 h were immunostained for NT-3 (red), GFAP (green), and DAPI (blue). G, anti-BDNF antibody detects two bands. 50 μg of lysate from unstimulated astrocytes was resolved next to pure rhBDNF. I, NaPB induces expression of mature BDNF. Primary mouse astrocytes stimulated with various concentrations of NaPB or 0.2 mm NaFO for 24 h were subjected to immunoblotting with anti-BDNF and anti-β-actin antibodies and subsequent densitometry (J). H, anti-NT-3 antibody detects two bands. 60 μg of lysate from unstimulated astrocytes was resolved next to pure recombinant mouse NT-3 (rmNT-3). K, NaPB induces expression of mature NT-3. Primary mouse astrocytes stimulated with various concentrations of NaPB or 0.2 mm NaFO for 24 h were subjected to immunoblotting with anti-NT-3 and anti-β-actin antibodies and subsequent densitometry (L). Each treatment condition is represented by two independent bands in I and K. ELISAs and densitometric analyses were analyzed for significance by one-way ANOVA (*, p < 0.01; **, p < 0.001). Scale bar, 20 μm. MRGD, merged image; MW, molecular weight; MPA, mouse primary astrocytes; HPA, human primary astrocytes.
FIGURE 3.
FIGURE 3.
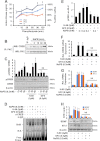
NaPB increases the expression of BDNF and NT-3 in primary mouse astrocytes via CREB. A, cells were treated with different doses of NaPB for 2 h followed by monitoring mRNA expression of CREB by qPCR (top) and RT-PCR (bottom). B, time course (30, 60, 120, 180, and 360 min; 0.2 mm) responses of CREB mRNA transcription was monitored by qPCR (top) and RT-PCR (bottom). C, total CREB expression is significantly up-regulated by NaPB. Cells stimulated with 0.05, 0.1, 0.2, or 0.5 mm NaPB for 24 h were subjected to immunoblotting with anti-CREB and anti-β-actin and analyzed by densitometry (top). D, NaPB time-dependently induces significant increases in CREB phosphorylation. Cells stimulated with 0.2 mm NaPB for 15, 30, 60, or 120 min were subjected to immunoblotting with anti-CREB-Ser(P)133 (pCREB) anti-CREB, and anti-β-actin and analyzed by densitometry (top). E, NaPB-mediated induction of phosphorylated CREB is localized to the nucleus. Astrocytes stimulated with 0.2 mm NaPB for 60 min were immunostained with anti-GFAP (green) and anti-CREB-Ser(P)133 (red) and treated with DAPI (blue). Whole cells and nuclei were captured using ×40 and ×60 objective lenses, respectively. Scale bar, 2 μm. F, the phosphorylation state of CREB is elevated by NaPB. Cells seeded in 96-well plates were treated with 0.2 mm NaPB for 15, 30, 60, or 120 min, fixed, permeabilized, subjected to infrared in-cell Western blotting with anti-CREB (blue) and CREB-Ser(P)133 (orange) antibodies, and analyzed for relative fluorescent units (top). G, NaPB induces DNA binding of CREB. Cells stimulated with 0.2 mm NaPB for 15, 30, or 60 min (left) were subjected to EMSAs. A supershift assay was performed with anti-CREB antibodies or IgG (right panel) to verify the presence of CREB in complex. H, NaPB elevates transcriptional activity of CREB. Astrocytes were transfected with pCRE-Luc (blue), pAP-1-Luc (orange), and pNFκB-Luc (navy). After 24 h of transfection, cells were treated with NaPB for 4 h followed by monitoring the luciferase activity in cell extracts. I and J, CREB siRNA successfully suppresses CREB expression. Cells were unstimulated or transfected with 0.25 μg of scrambled or CREB siRNA for 48 h and subjected to immunoblotting (I) with anti-CREB (blue) and anti-CREB-Ser(P)133 (orange) antibodies followed by densitometry (J). K and L, NaPB-mediated induction of BDNF and NT-3 mRNA is dependent upon CREB. Cells transfected with 0.25 μg of control or CREB siRNA for 48 h were unstimulated (blue) or treated with 0.2 mm NaPB (orange) or 0.2 mm NaFO (navy) for 6 h, and BDNF (K) and NT-3 (L) mRNA was examined by qPCR. M–O, NaPB-mediated induction of BDNF and NT-3 protein is dependent upon CREB. Cells transfected with 0.25 μg of control or CREB siRNA for 48 h were unstimulated (blue) or treated with 0.2 mm NaPB (orange) or 0.2 mm NaFO (navy) for 24 h, lysed, and immunoblotted with anti-BDNF and anti-NT-3 antibodies (M). Densitometry was performed on blots for NT-3 (N) and BDNF (O). Results represent three independent experiments. Each treatment condition is represented by two independent bands in C, D, I, and M. Data were analyzed for statistical significance by one-way ANOVA (*, p < 0.05; **, p < 0.01). Ab, antibody; MRGD, merged image; N.S., nonspecific; RLU, relative luciferase units; Scr, scrambled. Error bars, S.D.
FIGURE 4.
FIGURE 4.
PKC interacts with CREB to promote NaPB-induced synthesis of BDNF and NT-3 in primary mouse astrocytes. A, NaPB induces PKC activity. Cells were stimulated with 0.2 mm NaPB for various times followed by monitoring activities of PKA (orange) and PKC (blue). Differences (Δ; navy) between kinase activations were calculated as a forward difference argument (ΔF(P) = F(P + ΔP) − F(P)) × 100 to yield the percentage variance between kinase activation levels. B, NaPB promotes the association between PKC and CREB. Cells treated with 0.2 mm NaPB for various times were lysed, cleared, incubated with an anti-PKC antibody, separated by SDS-PAGE, and probed with an anti-CREB antibody. Blots for PKC verified that equal amounts of protein were loaded. C, PKC is required for NaPB to induce phosphorylation of CREB. Cells were treated with 0.2 mm NaPB alone or after preincubation with inhibitors of PKA (H-89; 2 μm) or PKC (GFX; 0.5 μm) for 1 h before being subjected to immunoblotting with antibodies against CREB-Ser(P)133, CREB, and β-actin and subsequent densitometry (top). D, inhibition of PKC abrogates NaPB-induced increases in DNA binding of CREB. Cells treated with 0.2 mm NaPB for 30 min alone or after preincubation with 2 μm H-89 or 0.5 μm GFX for 1 h were subjected to EMSA. The DNA-bound nuclear extract was incubated with antibodies against CREB or IgG to supershift the complex. E, inhibition of PKC abrogates the NaPB-induced increase in CREB transcriptional activation. Cells were transfected with a luciferase reporter construct driven by CREB, treated for 1 h with various concentrations of NaPB alone or after preincubation with 2 μm H-89 or 0.5 μm GFX for 1 h, and assayed for transcriptional activation via the luminometry. F, inhibition of PKC inhibits NaPB-induced increases in CREB transcription. Cells treated with 0.2 mm NaPB for 6 h alone or after preincubation with 2 μm H-89 or 0.5 μm GFX for 1 h were analyzed for mRNA transcription by qPCR. G, inhibition of PKC abrogates NaPB-mediated increases in BDNF and NT-3 mRNA. Astrocytes treated with 0.2 mm NaPB for 6 h alone or after preincubation with 2 μm H-89 or 0.5 μm GFX for 1 h were analyzed for BDNF (blue) and NT-3 (orange) mRNA transcription by qPCR. H, inhibition of PKC abrogates NaPB-induced increases in BDNF and NT-3 protein. Cells treated with 0.2 mm NaPB for 24 h alone or after preincubation with 2 μm H-89 or 0.5 μm GFX for 2 h were subjected to immunoblotting with antibodies against BDNF (blue) or NT-3 (orange) and β-actin and subsequent densitometry (top). Data (mean plus S.D. (error bars)) from three independent experiments were analyzed for statistical significance by one-way ANOVA (*, p < 0.05; **, p < 0.01). WB, Western blot; N.S., nonspecific; NS, not significant; Ab, antibody; RLU, relative luciferase units; NTR, neurotrophin.
FIGURE 5.
FIGURE 5.
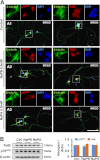
NaPB treatment remains unable to modulate the expression of neurotrophin receptors in primary mouse cortical neurons. A, NaPB does not alter p75NTR or TrkB expression in cortical neurons. Neurons seeded at ∼20% were unstimulated (A1) or treated with 0.5 mm NaPB (A2) or NaPA (A3) for 24 h; fixed; immunostained with antibodies against β-tubulin (green), p75NTR (left panels; red), and TrkB (right panels; red); and treated with DAPI (blue). Whole cell images and somatic images were captured using ×20 and ×60 objective lenses, respectively. Scale bar, 50 μm. B, NaPB does not alter p75NTR or TrkB expression. Neurons unstimulated or treated with 0.5 mm NaPB or 0.5 mm NaPA for 24 h were subjected to immunoblotting with antibodies against p75NTR (blue), TrkB (orange), and β-actin and subsequent densitometry (right). Data (mean plus S.D. (error bars)) from three independent experiments were analyzed for statistical significance by one-way ANOVA. Each treatment condition is represented by two independent bands in B. MRGD, merged image; NS, not significant; Ctrl, control.
FIGURE 6.
FIGURE 6.
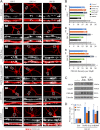
NaPB-treated astroglial supernatant propagates synaptic development. A, PSD-95 expression is increased by supernatant (sup) from primary mouse astrocytes treated with NaPB. Fetal hippocampal neurons were isolated, plated and seeded at ∼20% confluence for 7 (left; DIV 7), 14 (middle; DIV 14), or 21 (right; DIV 21) days. After 3 days, neurons were either unstimulated (A1) or treated with glial supernatant from unstimulated astrocytes (A2), glial supernatant from NaPB-stimulated astrocytes (A3), glial supernatant from NaPB-stimulated astrocytes plus an anti-TrkB blocking antibody (A4), an anti-TrkB blocking antibody alone (A5), or 10 ng/ml rhBDNF as a positive control (A6). See “Materials and Methods” for culture and treatment details. Cells were then fixed and immunostained with antibodies against MAP-2 (red) and PSD-95 (white). Whole cell images and spine images were captured using ×40 and ×100 objective lenses, respectively. B, quantification of PSD-95 puncta in A. 50 representative images were taken from 10 to 15 neurons and counted based on exclusion-inclusion criteria (see “Materials and Methods”). Data are expressed as the number of puncta per 25 μm dendritic shaft for DIV 7 (B1), DIV 14 (B2), and DIV 21 (B3). Blue, unstimulated; orange, control supernatant; navy, NaPB-treated supernatant; green, NaPB-treated supernatant plus anti-TrkB blocking antibody; black, anti-TrkB blocking antibody; gray, rhBDNF. C, supernatant from astrocytes stimulated with NaPB induces the expression of glutamatergic receptor subunits. Neurons stimulated with supernatant from NaPB-treated astrocytes or 10 ng/ml rhBDNF for 21 days were subjected to immunoblotting with antibodies against PSD-95 (blue), AMPA receptor subunit 1 (GluR1; orange), NMDA receptor subunit 2a (NR2A; navy), and β-tubulin, and subsequent densitometry is depicted in D. Data in C and D (mean plus S.D. (error bars)), representative of three independent experiments, were analyzed for statistical significance by one-way ANOVA (*, p < 0.05; **, p < 0.01). Each treatment condition is represented by two independent bands in C. sup, supernatant.
FIGURE 7.
FIGURE 7.
Oral administration of NaPB up-regulates BDNF and NT-3 in vivo in the CNS of 5XFAD and non-Tg mice. A, monitoring NaPA, a metabolite of NaPB, in the CNS of NaPB-fed non-Tg mice. Cortical homogenates from non-Tg mice treated with NaPB (100 mg of NaPB per kg of body weight every day; bottom) or vehicle (H2O; middle) by gavage were analyzed by HPLC. NaPA dissolved in H2O was the positive control (top), and gemfibrozil (gem) was used as an internal standard. B, NaPB propagates the interaction between CREB and PKC in vivo. Hippocampal homogenates from 5XFAD mice fed vehicle (blue) or NaPB (orange) were cleared; coimmunoprecipitated with anti-IgG, anti-PKC, or anti-CREB antibodies; immunoblotted with anti-PKC (top) or anti-CREB (bottom) antibodies; and analyzed by densitometry (bottom). Inputs were determined by immunoblotting for the same pull-down. C, NaPB induces BDNF and NT-3 expression in non-Tg mice. Cortical (top three panels) and hippocampal (bottom three panels) homogenates from mice fed vehicle (blue) or NaPB (orange) were subjected to immunoblotting with antibodies against BDNF, NT-3, and β-actin and subsequent densitometry (right). Bands correspond to independent animals. D, NaPB induces BDNF and NT-3 expression in 5XFAD mice. Cortical (top three panels) and hippocampal (bottom three panels) homogenates from mice fed vehicle (blue) or NaPB (orange) were subjected to immunoblotting with antibodies against BDNF, NT-3, and β-actin and subsequent densitometry (right). Bands correspond to independent animals. E, NaPB up-regulates PSD-95 in 5XFAD hippocampi. Hippocampal homogenates from 5XFAD and non-Tg (data not shown) mice fed vehicle (blue) or NaPB (orange) were subjected to immunoblotting with antibodies against PSD-95 and β-tubulin and subsequent densitometry (right). Bands correspond to independent animals. Data (mean plus S.D. (error bars)) representative of three or six independent experiments were analyzed for statistical significance by Student's t tests (*, p < 0.05; **, p < 0.01). WB, Western blot; HPC, hippocampus; Veh, vehicle; IP, immunoprecipitation.
FIGURE 8.
FIGURE 8.
NaPB increases astrocytic BDNF expression in CA1. A, colocalization of BDNF with GFAP in the mouse hippocampus. Shown is a representative coronal section of a non-Tg mouse treated with vehicle (Veh) (H2O) captured with a ×4 objective lens (scale bar, 250 μm). B, NaPB induces BDNF expression in mouse astrocytes in vivo. Free floating coronal sections from non-Tg mice fed vehicle (B1) or NaPB (B2) and 5XFAD mice fed vehicle (B3) or NaPB (B4) were immunostained for BDNF (red), GFAP (green), and DAPI (blue). Images represent the boxed region of CA1 in A (scale bar, 25 μm). C–F, NaPB does not significantly alter astrocyte morphology. Three serial sections within CA1 from non-Tg mice fed vehicle (blue) or NaPB (orange) and 5XFAD mice fed vehicle (navy) or NaPB (green) (n = 4, all groups) were analyzed for GFAP fluorescence intensity (C) and area (D) using MicroSuite FIVETM Biological Suite. Box plots in D represent area quartile (quartile 1 (Q1), median, quartile 3 (Q3)) dispersion, whiskers represent area maximums/minimums, and white insets represent area mean ± S.E. (error bars) for each group. Representative astrocytes, tracings, and areas from each quartile are represented in E. Astrocytes within each quartile range were quantified as a percentage of total cells counted in each group and presented as a 100% stacked column chart in F. G, NaPB induces expression of BDNF in astrocytes of various sizes. BDNF-immunoreactive (BDNF+) astrocytes were counted and quantified as a percentage of GFAP-immunoreactive (GFAP+) astrocytes for all quartiles. See “Materials and Methods” for detailed stereological morphometry information. Data were analyzed for statistical significance by one-way ANOVA (*, p < 0.05; **, p < 0.01). CA; cornu ammonis; DG, dentate gyrus; SO, stratum oriens; SP, stratum pyrimidale; SR, stratum radiatum.
FIGURE 9.
FIGURE 9.
NaPB improves spatial learning and memory in non-Tg and 5XFAD transgenic mice. A, NaPB does not affect gross motor or exploratory behavior. Non-Tg mice fed vehicle (Veh) (H2O; blue) or NaPB (orange) and 5XFAD mice fed vehicle (navy) or NaPB (green) were recorded every 1 min for 30 min on the open field test 24 h after the final treatment. Values are expressed as averages of 3-min bins. B–D, NaPB improves performance on the Barnes maze task. B, 48 h following the final acquisition trial, errors made prior to the first encounter with the target hole (primary errors) and errors made prior to escape (total errors) were quantified for non-Tg mice fed vehicle (blue) or NaPB (orange) and 5XFAD mice fed vehicle (navy) or NaPB (green). C, latency to the first encounter with the target hole (primary latency) and latency to escape (total latency) were quantified for non-Tg mice fed vehicle (blue) or NaPB (orange) and 5XFAD mice fed vehicle (navy) or NaPB (green). D, time spent in the target quadrant (TQ) before the first encounter with the target hole (primary time in target quadrant) and time spent in the target quadrant prior to escape (total time in target quadrant) were quantified for non-Tg mice fed vehicle (blue) or NaPB (orange) and 5XFAD mice fed vehicle (navy) or NaPB (green). For all studies, n = 6 for non-Tg mice fed vehicle, n = 6 for non-Tg mice fed NaPB, n = 5 for 5XFAD mice fed vehicle, and n = 6 for 5XFAD mice fed NaPB. Mice were fed vehicle or 100 mg of NaPB per kg of body weight every day for 30 days. Data were analyzed for statistical significance by one-way ANOVA followed by Games-Howell post hoc tests (*, p < 0.05; **, p < 0.01). NS, not significant. Error bars, S.D.

Similar articles

Cited by

References

    1. Lewin G. R., Barde Y. A. (1996) Physiology of the neurotrophins. Annu. Rev. Neurosci. 19, 289–317 - PubMed
    1. McAllister A. K., Katz L. C., Lo D. C. (1999) Neurotrophins and synaptic plasticity. Annu. Rev. Neurosci. 22, 295–318 - PubMed
    1. Sofroniew M. V., Howe C. L., Mobley W. C. (2001) Nerve growth factor signaling, neuroprotection, and neural repair. Annu. Rev. Neurosci. 24, 1217–1281 - PubMed
    1. Chao M. V. (2003) Neurotrophins and their receptors. A convergence point for many signalling pathways. Nat. Rev. Neurosci. 4, 299–309 - PubMed
    1. Thoenen H. (1995) Neurotrophins and neuronal plasticity. Science 270, 593–598 - PubMed

Publication types

MeSH terms