

doi: 10.1002/adma.201204623.
Epub 2013 Feb 13.
Single continuous wave laser induced photodynamic/plasmonic photothermal therapy using photosensitizer-functionalized gold nanostars
Affiliations
- PMID: 23404693
- PMCID: PMC4138877
- DOI: 10.1002/adma.201204623
Item in Clipboard
Single continuous wave laser induced photodynamic/plasmonic photothermal therapy using photosensitizer-functionalized gold nanostars
Adv Mater.
.
Abstract
Chlorin e6 conjugated gold nanostars (GNS-PEG-Ce6) are used to perform simultaneous photodynamic/plasmonic photothermal therapy (PDT/PPTT) upon single laser irradiation. The early-phase PDT effect is coordinated with the late-phase PPTT effect to obtain synergistic anticancer efficiency. The prepared GNS-PEG-Ce6 shows excellent water dispersibility, good biocompatibility, enhanced cellular uptake and remarkable anticancer efficiency upon irradiation in vivo.
Copyright © 2013 WILEY-VCH Verlag GmbH & Co. KGaA, Weinheim.
Figures
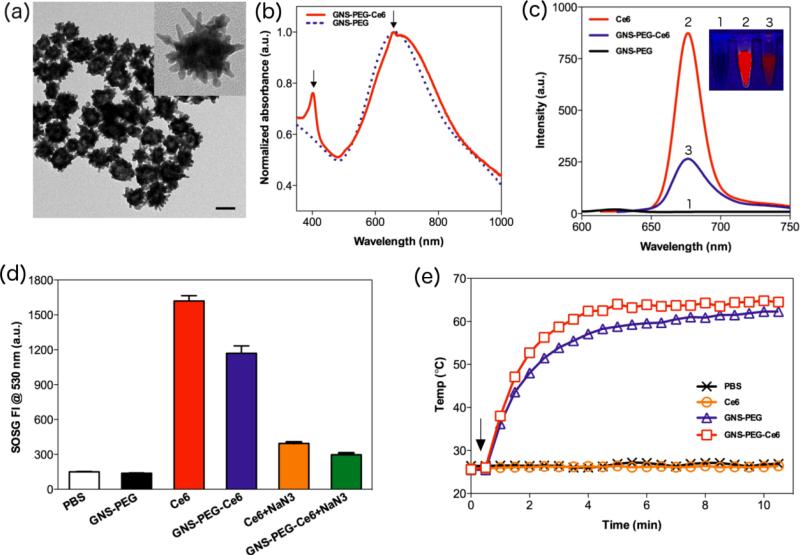
(a) TEM images of GNS-PEG-Ce6 dispersed in ultra pure water. Scale bar, 50 nm. (b) Normalized UV-Vis spectra of GNS-PEG and GNS-PEG-Ce6. Arrows indicate the characteristic absorption peaks at 404 and 658 nm. (c) Fluorescence spectra of free Ce6, GNS-PEG and GNS-PEG-Ce6. (Insert are the fluorescence images of 0.175 nM GNS-PEG, 1 μM free Ce6 and 0.175 nM GNS-PEG-Ce6. From left to right: GNS-PEG, free Ce6, GNSPEG-Ce6) (d) SOSG fluorescence intensity (FI) at 530 nm in PBS, 0.175nM GNS-PEG, 1 μM free Ce6 (−/+ 10 μM NaN3) and 0.175 nM GNS-PEG-Ce6 (−/+ 10 μM NaN3) solutions after 671 nm laser irradiation (2.0 W/cm2, 10 min). (e) Heating curves of PBS, 0.7 nM GNS-PEG, 4 μM free Ce6 and 0.7 nM GNS-PEG-Ce6. Arrow indicates the start time point of laser irradiation (2.0 W/cm2, 10 min).
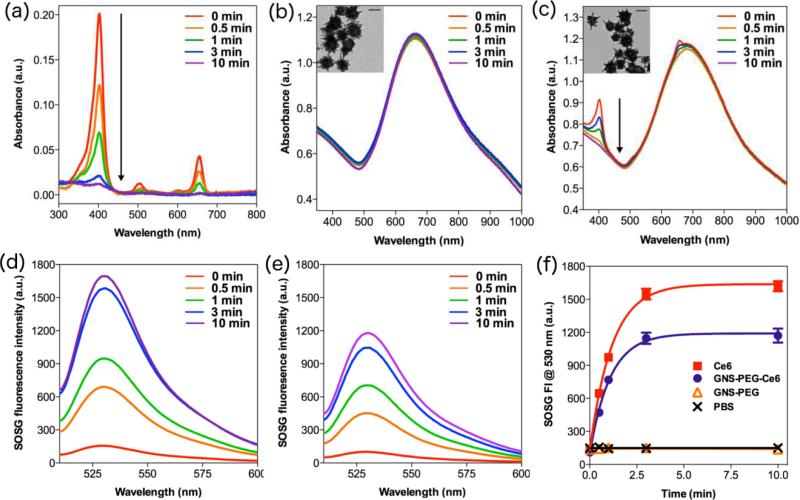
UV-Vis spectra of (a) 1 μM free Ce6, (b) 0.175 nM GNS-PEG, (c) 0.175 nM GNSPEG-Ce6 after different time of irradiation (671 nm, 2.0 W/cm2). Inserts are TEM images of GNS-PEG and GNS-PEG-Ce6 after irradiation. Scale bars, 50 nm. SOSG fluorescence spectra of (d) 1 μM free Ce6, (e) 0.175 nM GNS-PEG-Ce6 after different time of irradiation (671 nm, 2.0 W/cm2). (f) SOSG fluorescence intensity at 530 nm in PBS, 0.175 nM GNS-PEG, 1 μM free Ce6 and 0.175 nM GNS-PEG-Ce6 after different time of irradiation (671 nm, 2.0 W/cm2).
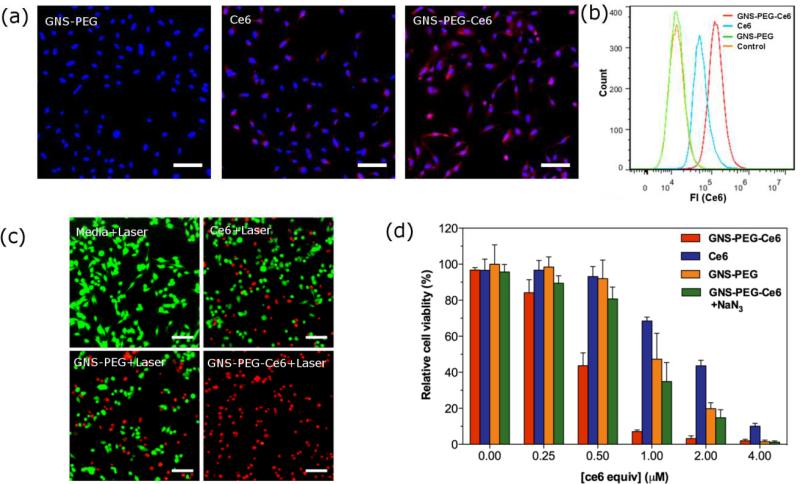
(a) Fluorescence image of MDA-MB-435 cells incubated with 0.875 nM GNS-PEG, 5 μM free Ce6 or 0.875 nM GNS-PEG-Ce6 after 24 h. Scale bars, 50 μm. (b) Flow cytometric analysis of mean fluorescence intensity (n = 10, 000 cells) in MBA-MB-435 cells incubated with media (orange), 0.875 nM GNS-PEG (green), 5 μM free Ce6 (blue), and 0.875 nM GNSPEG-Ce6 (red) for 24 h. (c) Fluorescence image of Calcein AM/Ethidium homodimer-1 stained MDA-MB-435 cells incubated with media, 1 μM free Ce6, 0.175 nM GNS-PEG or 0.175 nM GNS-PEG-Ce6 for 24 h after laser irradiation (671 nm, 2.0 W/cm2). Scale bars, 50 μm. (d) Relative viability of MDA-MB-435 cells incubated with various concentrations of free Ce6, GNS-PEG, GNS-PEG-Ce6 with or without 100 μM NaN3 after irradiation by 671 nm laser (2.0 W/cm2, 10 min).
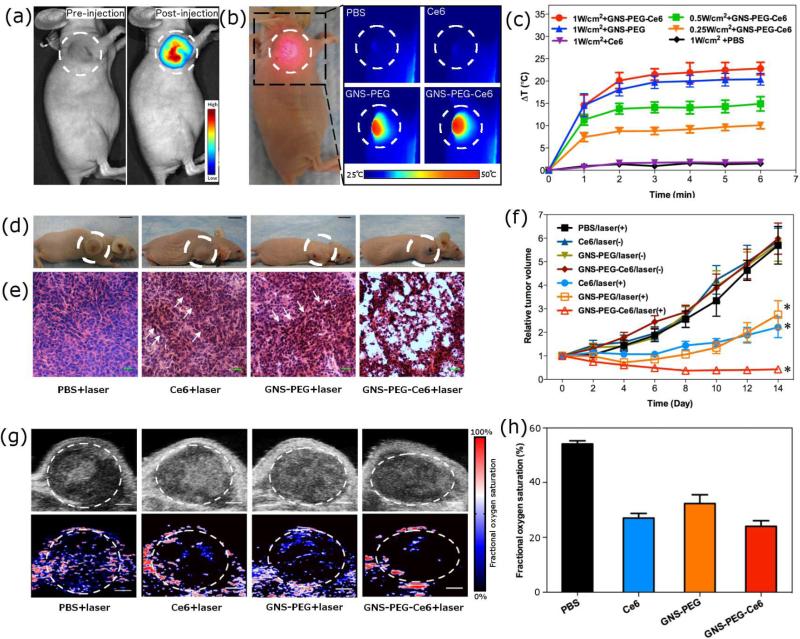
In vivo theranostic applications of GNS-PEG-Ce6. (a) Fluorescence imaging of MDA-MB-435 tumor-bearing mice at pre-injection and 4 h post-injection of GNS-PEG-Ce6. (b) Thermal imaging of MDA-MB-435 tumor-bearing mice exposed to 671 nm laser (1.0 W/cm2) for 6 min at 4 h post-injection of PBS, Ce6, GNS-PEG, or GNS-PEG-Ce6. Photo in left panel indicates mice in irradiation process. Circles indicate the location of tumors. (c) Heating curves of tumors upon 671 nm laser irradiation over time. (d) Representative photos of MDA-MB-435 tumor-bearing mice from different groups 14 days after treatment. Circles indicate the location of tumors. (e) H&E stained tumor sections collected from different groups of mice eight days post treatment. Arrows indicate the sporadic necrotic areas. (f) Tumor growth curves of different groups of tumor-bearing mice after treatment. Tumor volumes were normalized to their initial sizes. Error bars represent the standard deviations of 4-6 mice per group. Asterisk means P < 0.05. (g) Ultrasound (upper row) and photoacoustic (lower row) imaging of MDA-MB-435 tumor-bearing mice exposed to 671 nm laser (1.0 W/cm2) for 6 min at 4 h post-injection of PBS, Ce6, GNS-PEG, or GNS-PEG-Ce6. Circles indicate the region of interest in tumors. Scale bars, 1 mm. (h) Quantitative analysis of fractional oxygen saturation of photoacousitc data in figure g.
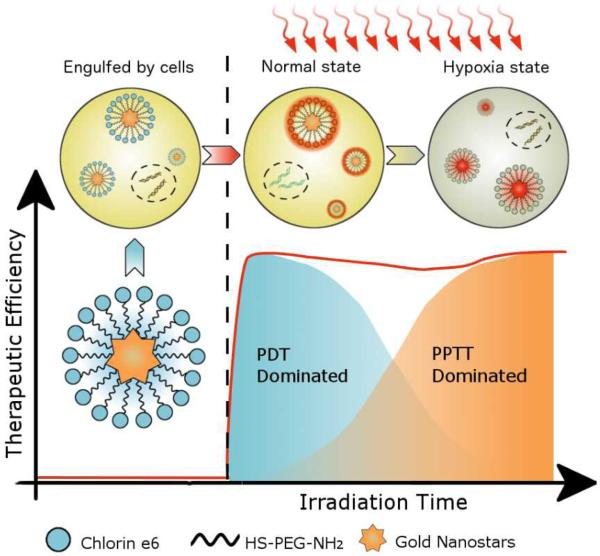
A schematic representation for explaining coordinated PDT/PPTT treatment upon single laser irradiation.
References
Publication types
MeSH terms
Substances
Grants and funding
LinkOut - more resources
Full Text Sources
Other Literature Sources
