Review
. 2013;18(2):123-33.
doi: 10.1634/theoncologist.2012-0397. Epub 2013 Feb 12.

Molecular characterization of basal-like and non-basal-like triple-negative breast cancer

Affiliations
Review

Molecular characterization of basal-like and non-basal-like triple-negative breast cancer

Aleix Prat et al. Oncologist. 2013.

Abstract

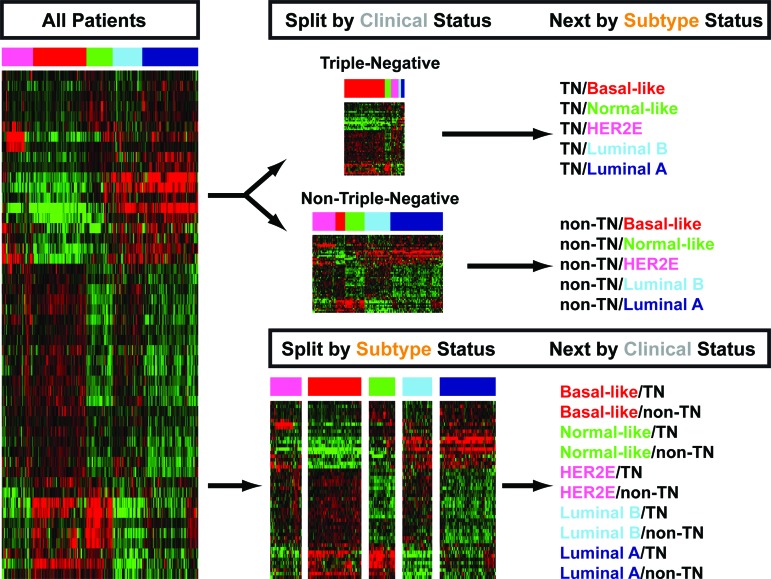
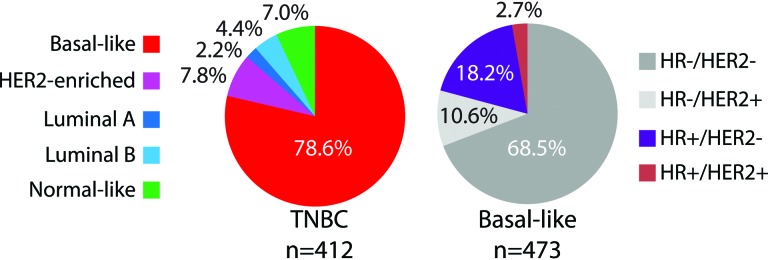
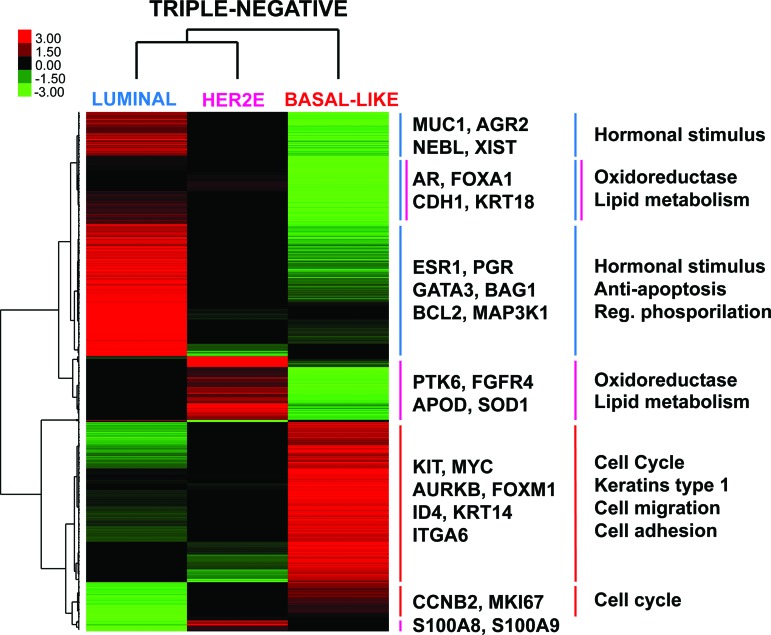
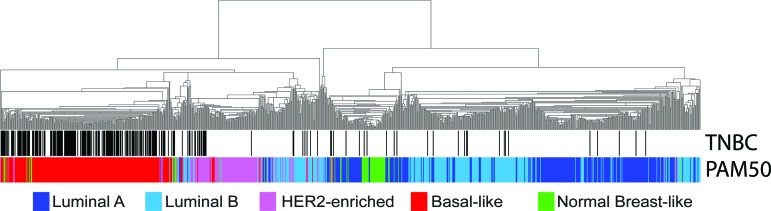
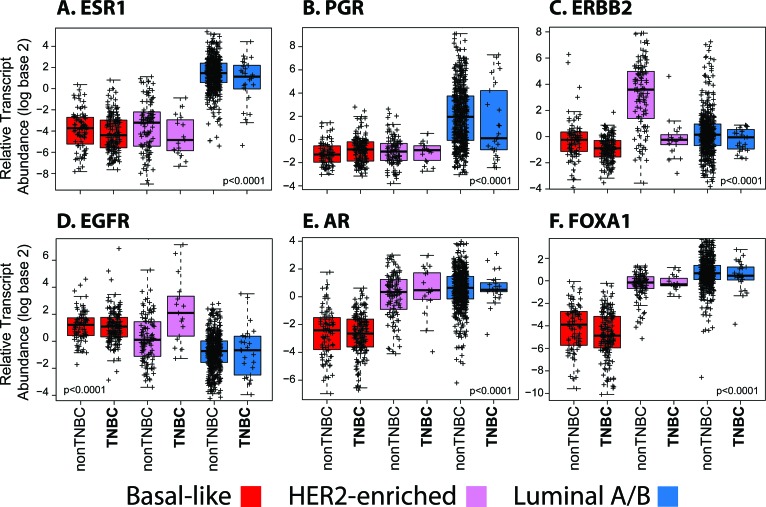
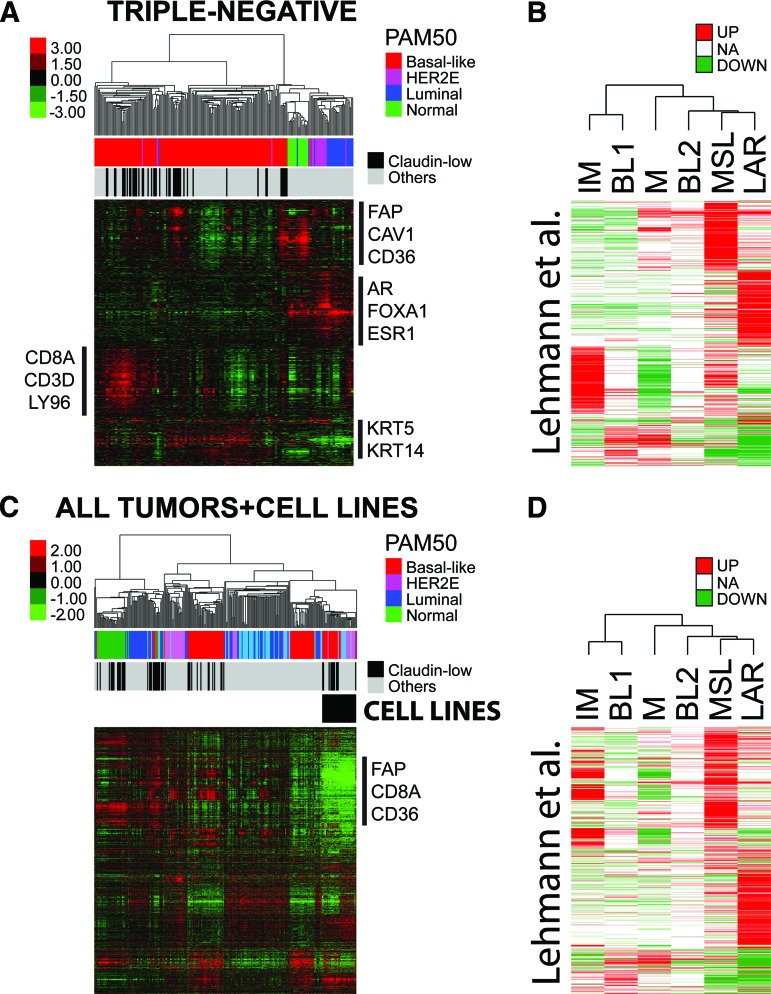
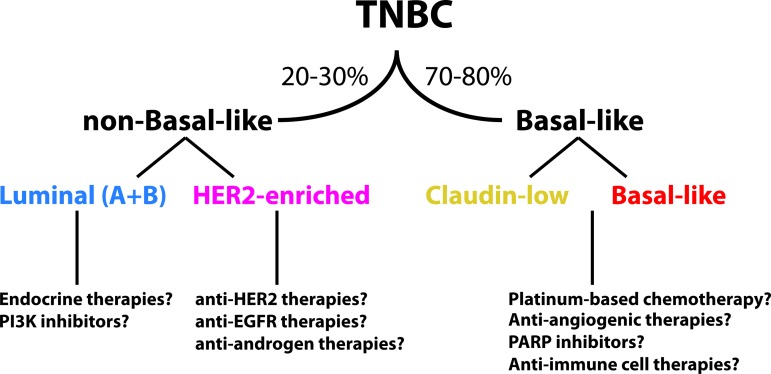
Triple-negative (TN) and basal-like (BL) breast cancer definitions have been used interchangeably to identify breast cancers that lack expression of the hormone receptors and overexpression and/or amplification of HER2. However, both classifications show substantial discordance rates when compared to each other. Here, we molecularly characterize TN tumors and BL tumors, comparing and contrasting the results in terms of common patterns and distinct patterns for each. In total, when testing 412 TN and 473 BL tumors, 21.4% and 31.5% were identified as non-BL and non-TN, respectively. TN tumors identified as luminal or HER2-enriched (HER2E) showed undistinguishable overall gene expression profiles when compared versus luminal or HER2E tumors that were not TN. Similar findings were observed within BL tumors regardless of their TN status, which suggests that molecular subtype is preserved regardless of individual marker results. Interestingly, most TN tumors identified as HER2E showed low HER2 expression and lacked HER2 amplification, despite the similar overall gene expression profiles to HER2E tumors that were clinically HER2-positive. Lastly, additional genomic classifications were examined within TN and BL cancers, most of which were highly concordant with tumor intrinsic subtype. These results suggest that future clinical trials focused on TN disease should consider stratifying patients based upon BL versus non-BL gene expression profiles, which appears to be the main biological difference seen in patients with TN breast cancer.


Conflict of interest statement

Disclosures of potential conflicts of interest may be found at the end of this article.

Figures

Figure 1.
Figure 1.
Representative algorithm of the two main clinical phenotypes (triple-negative versus non-triple-negative) and the various molecular intrinsic subtypes analyzed in this study. The gene expression heatmap represents the 50 genes of the PAM50 subtype predictor and the PAM50 microarray training data set. Abbreviation: TN, triple-negative.
Figure 2.
Figure 2.
Distribution of the intrinsic molecular and pathology-based subtypes within triple-negative and basal-like tumors. Abbreviations: HR, hormone receptor; TNBC, triple-negative breast cancer.
Figure 3.
Figure 3.
Subtype-specific gene expression profiles within triple-negative disease. Each colored square represents the relative mean gene score for each subtype, with highest expression shown in red, average expression in black, and lowest expression in green. This gene list was obtained by performing a three-class (luminal, HER2E and basal-like) significance analysis of microarrays within triple-negative disease (False Discovery Rate = 0%). On the right, selected genes symbols of several gene clusters are shown, as well as selected gene ontology biological processes found significantly enriched in each gene cluster. Abbreviations: AGR2, anterior gradient 2 homolog; APOD, apolipoprotein D; AR, androgen receptor; AURKB, aurora kinase B; BAG1, BCL2-associated athanogene; CCNB2, cyclin B2; CDH1, E-cadherin 1; ESR1, estrogen receptor; FGFR4, fibroblast growth factor receptor 4; ITGA6, integrin alpha 6; KRT, keratin; MUC1, mucin 1; NEBL, nebulette; PGR, progesterone receptor; PTK6, protein tyrosine kinase 6; S100, S100 calcium binding protein; SOD1, superoxide dismutase 1; XIST, inactive X specific transcripts.
Figure 4.
Figure 4.
Hierarchical clustering of 1,005 tumors from a combined data set using the available PAM50 genes (n = 40 of 50). All samples have known estrogen receptor, progesterone receptor, and HER2 status. Triple-negative samples and the PAM50 calls are shown below the array tree. Abbreviation: TNBC, triple-negative breast cancer.
Figure 5.
Figure 5.
Box-and-whisker plots for expression of selected breast cancer-related genes based on the intrinsic subtype and triple-negative status. p values were calculated by comparing mean values across all groups. Abbreviation: TNBC, triple-negative breast cancer.
Figure 6.
Figure 6.
Summarized molecular data of triple-negative tumors from The Cancer Genome Atlas (TCGA) data set [25]. (A): Molecular data of the 12 triple-negative (TN)/non-basal-like tumors is shown. (B): Overall data of the HER2E (n = 5), luminal/normal (n = 7), and basal-like (n = 78) groups within TN disease is shown. The PAM50 proliferation score was calculated by estimating the mean expression of 11 proliferation-related genes. Percentiles of the PAM50 proliferation score across the entire TCGA data set are shown for each sample. For reverse-phase protein array data, low, average and high values are relative to the log base 2 median expression of that particular protein across the entire TCGA data set (<−1 expression = low; −1 to +1 = average; >+1 = high). Abbreviations: AR, androgen receptor; ER, estrogen receptor; Mut, mutations; NA, not available; PR, progesterone receptor; PROLIF, PAM50 proliferation score; ROR, risk of relapse; RPPA, reverse-phase protein array; TN, triple-negative.
Figure 7.
Figure 7.
Triple-negative (TN) tumors classified by gene signatures from Lehmann et al. [11]. (A): Supervised hierarchical clustering of 224 TN tumors from the combined data set using the centroid gene list from from Lehmann et al. Each colored square represents the relative mean transcript abundance (in log2 space) for each subtype, with highest expression shown in red, median expression in black, and lowest expression in green. PAM50 and claudin-low subtype calls are identified below the array tree. (B): Genes from the clustering in (A) that distinguish each subtype identified in Lehmann et al. Red and green indicate the expression direction (upregulated or downregulated, respectively) in each subtype. (C): Supervised hierarchical clustering of 250 breast samples and 37 cell lines representing all subtypes using the centroid gene list from Lehmann et al. (D): Genes from the clustering in (C) that distinguish each subtype identified in Lehmann et al. Abbreviations: AR, androgen receptor; BL1, basal-like 1; BL2, basal-like 2; CAV1, caveolin 1; ESR1, estrogen receptor; FAP, fibroblast activation protein; IM, immunomodulatory; KRT, keratin; LAR, luminal androgen receptor; LY96, lymphocyte antigen 96; M, mesenchymal; MSL, mesenchymal stem-like; NA, not available.
Figure 8.
Figure 8.
Proposed algorithm of stratification of triple-negative tumors. Abbreviations: EGFR, epidermal growth factor receptor; PARP, poly (ADP-ribose) polymerase.

Comment in

References

    1. Perou CM, Sorlie T, Eisen MB, et al. Molecular portraits of human breast tumours. Nature. 2000;406:747–752. - PubMed
    1. Prat A, Perou CM. Deconstructing the molecular portraits of breast cancer. Mol Oncol. 2011;5:5–23. - PMC - PubMed
    1. Prat A, Ellis MJ, Perou CM. Practical implications of gene-expression-based assays for breast oncologists. Nat Rev Clin Oncol. 2012;9:48–57. - PMC - PubMed
    1. Sorlie T, Perou C, Tibshirani R, et al. Gene expression patterns of breast carcinomas distinguish tumor subclasses with clinical implications. Proc Natl Acad Sci U S A. 2001;98:10869–10874. - PMC - PubMed
    1. Nielsen TO, Parker JS, Leung S, et al. A comparison of PAM50 intrinsic subtyping with immunohistochemistry and clinical prognostic factors in tamoxifen-treated estrogen receptor-positive breast cancer. Clin Cancer Res. 2010;16:5222–5232. - PMC - PubMed

Publication types

MeSH terms