

Divergent neural substrates of inhibitory control in binge eating disorder relative to other manifestations of obesity
- PMID: 23404820
- PMCID: PMC3610836
- DOI: 10.1002/oby.20068
Divergent neural substrates of inhibitory control in binge eating disorder relative to other manifestations of obesity
Abstract
Objective: An important endeavor involves increasing our understanding of biobehavioral processes underlying different types of obesity. The current study investigated the neural correlates of cognitive control (involving conflict monitoring and response inhibition) in obese individuals with binge eating disorder (BED) as compared to BMI-matched non-BED obese (OB) individuals and lean comparison (LC) participants. Alterations in cognitive control may contribute to differences in behavioral control over eating behaviors in BED and obesity.
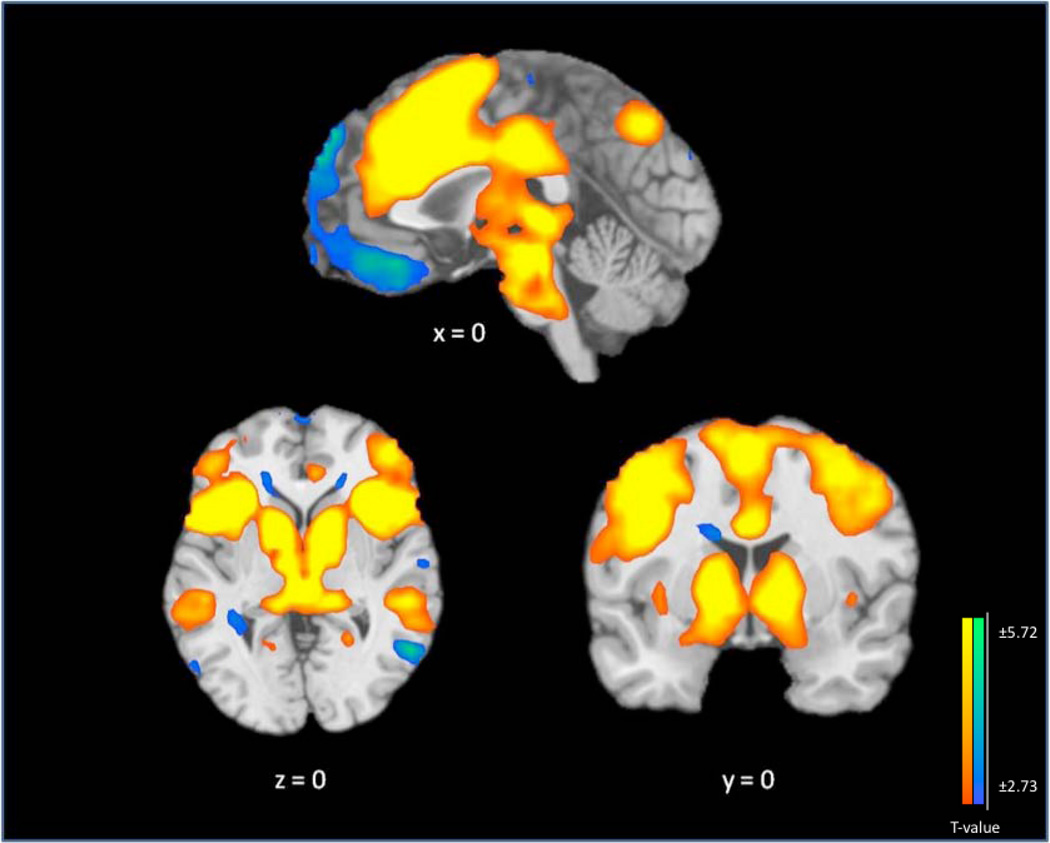
Design and methods: Participants underwent functional magnetic resonance imaging while completing the Stroop color-word interference task.
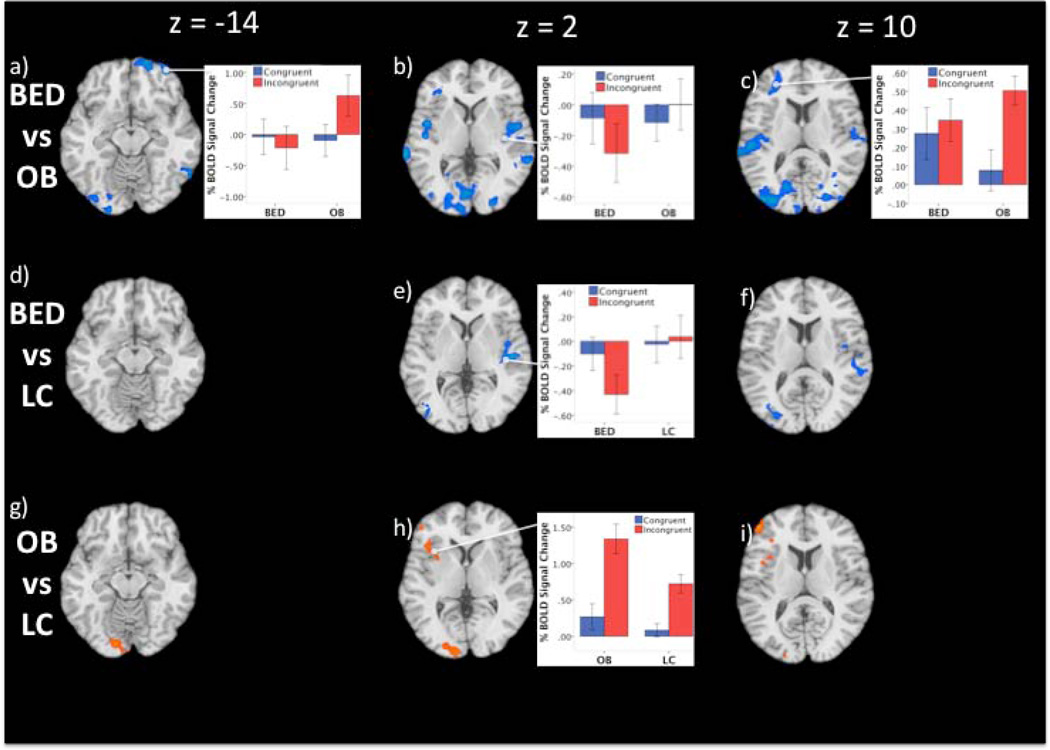
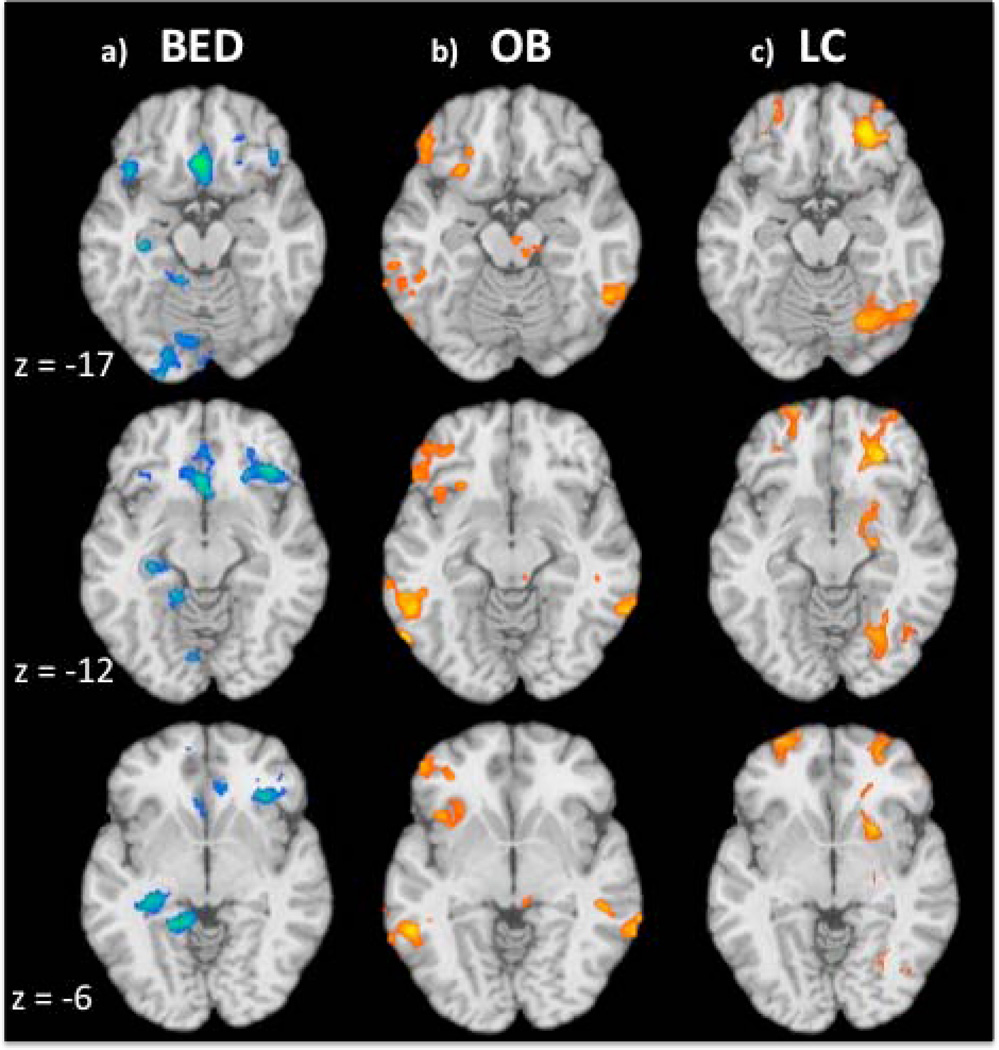
Results and conclusions: Relative to the OB and LC groups, activity in the BED group was differentiated by relative hypoactivity in brain areas involved in self-regulation and impulse control. Specifically, the BED group showed diminished activity in the ventromedial prefrontal cortex (vmPFC), inferior frontal gyrus (IFG), and insula during Stroop performance. In addition, dietary restraint scores were negatively correlated with right IFG and vmPFC activation in the BED group, but not in the OB or HC groups. Thus, BED individuals' diminished ability to recruit impulse-control-related brain regions appears associated with impaired dietary restraint. The observed differences in neural correlates of inhibitory processing in BED relative to OB and LC groups suggest distinct eurobiological contributions to binge eating as a subgroup of obese individuals.
Copyright © 2012 The Obesity Society.
Conflict of interest statement
The authors report that they have no financial conflicts of interest with respect to the content of this manuscript.
Figures
References
-
- Flegal KM, Carroll MD, Ogden CL, Curtin LR. Prevalence and trends in obesity among US adults, 1999–2008. JAMA. 2010;303:235–241. - PubMed
-
- Davis CA, Levitan RD, Reid C, et al. Dopamine for "wanting" and opioids for "liking": a comparison of obese adults with and without binge eating. Obesity (Silver Spring) 2009;17:1220–1225. - PubMed
-
- APA. Diagnostic and statistical manual of mental disorders, 4th edition, Text Revision. Washington, DC: 2004.
Publication types
MeSH terms
Grants and funding
- R01-DA020908/DA/NIDA NIH HHS/United States
- P20 DA027844/DA/NIDA NIH HHS/United States
- K12-DA00167/DA/NIDA NIH HHS/United States
- RL1 AA017539/AA/NIAAA NIH HHS/United States
- P20-DA027844/DA/NIDA NIH HHS/United States
- R01 AA016599/AA/NIAAA NIH HHS/United States
- PL1 DA024859/DA/NIDA NIH HHS/United States
- K12 DA000167/DA/NIDA NIH HHS/United States
- K24 DK070052/DK/NIDDK NIH HHS/United States
- R01 DK073542/DK/NIDDK NIH HHS/United States
- R01 DA019039/DA/NIDA NIH HHS/United States
- R01-AA016599/AA/NIAAA NIH HHS/United States
- 2K24 DK070052/DK/NIDDK NIH HHS/United States
- PL1-DA024859/DA/NIDA NIH HHS/United States
- P50-AA012870/AA/NIAAA NIH HHS/United States
- R01 DA020908/DA/NIDA NIH HHS/United States
- R01-DA019039/DA/NIDA NIH HHS/United States
- RL1-AA017539/AA/NIAAA NIH HHS/United States
- P50 AA012870/AA/NIAAA NIH HHS/United States
LinkOut - more resources
Full Text Sources
Other Literature Sources
Medical
Miscellaneous
