. 2013 Apr;64(6):1715-29.
doi: 10.1093/jxb/ert036. Epub 2013 Feb 11.

Generation and analysis of a complete mutant set for the Arabidopsis FT/TFL1 family shows specific effects on thermo-sensitive flowering regulation

Affiliations

Generation and analysis of a complete mutant set for the Arabidopsis FT/TFL1 family shows specific effects on thermo-sensitive flowering regulation

Wanhui Kim et al. J Exp Bot. 2013 Apr.

Abstract

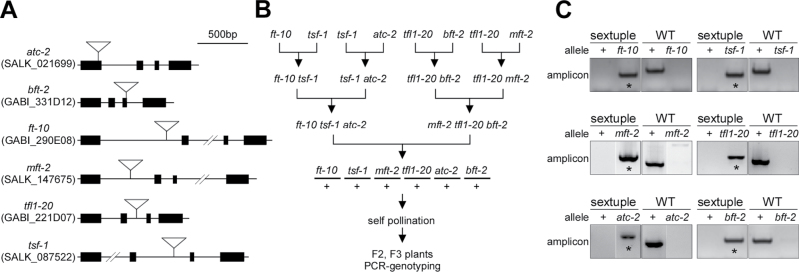
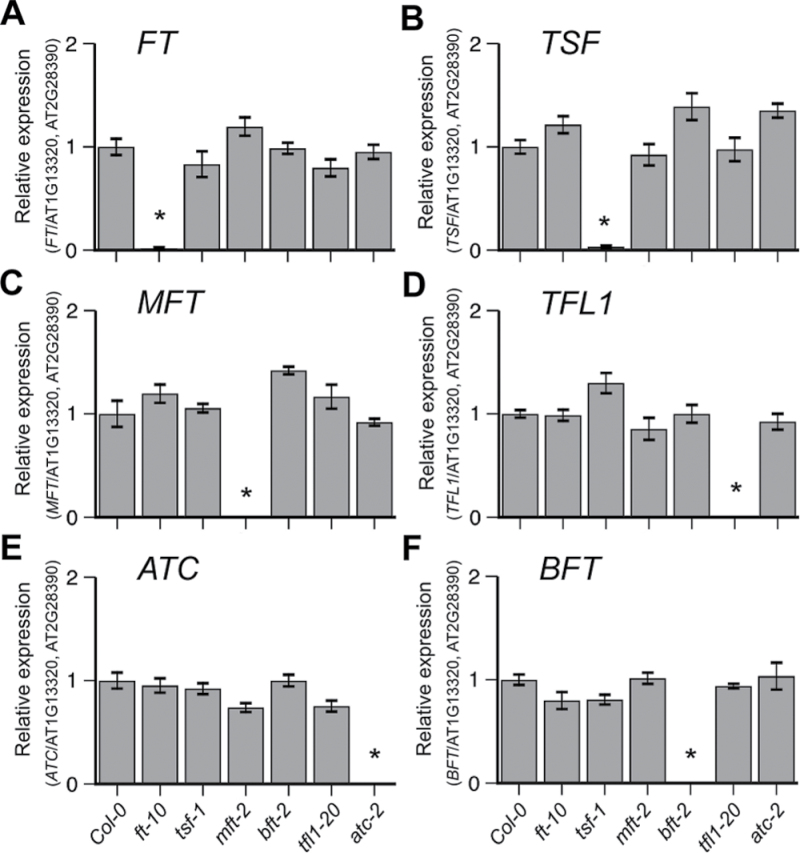
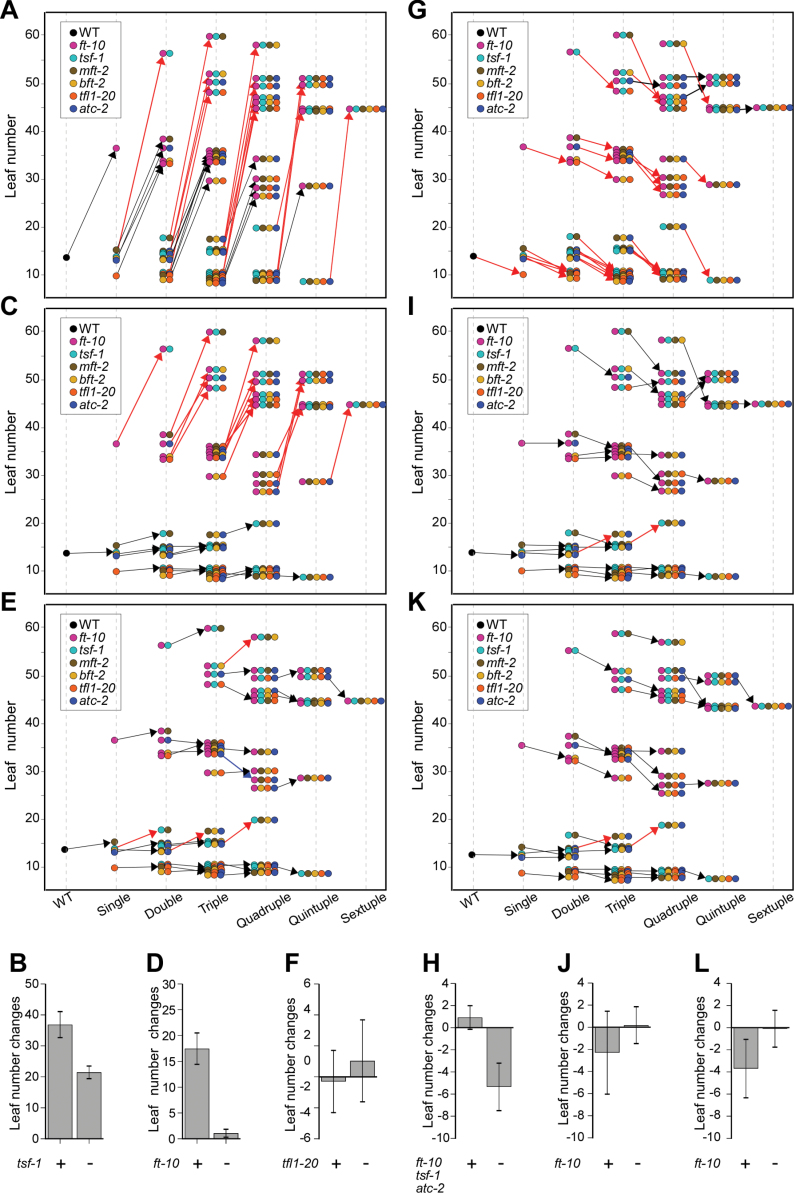
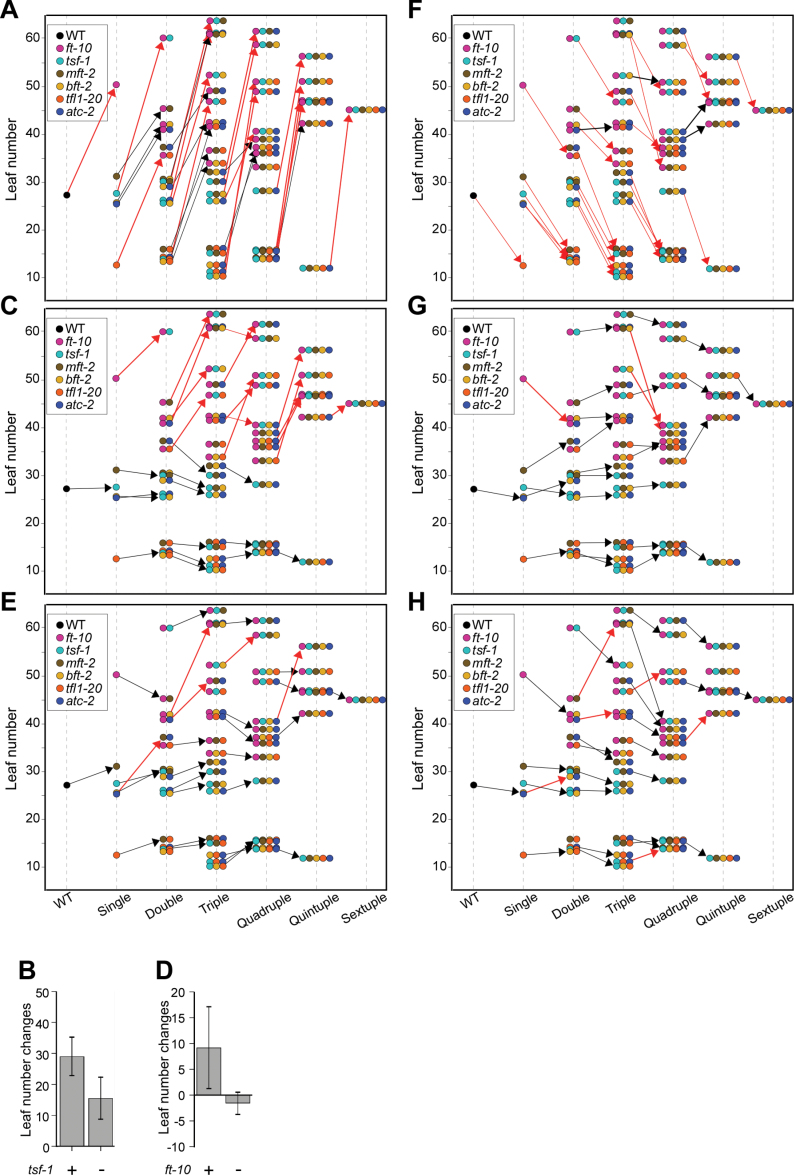
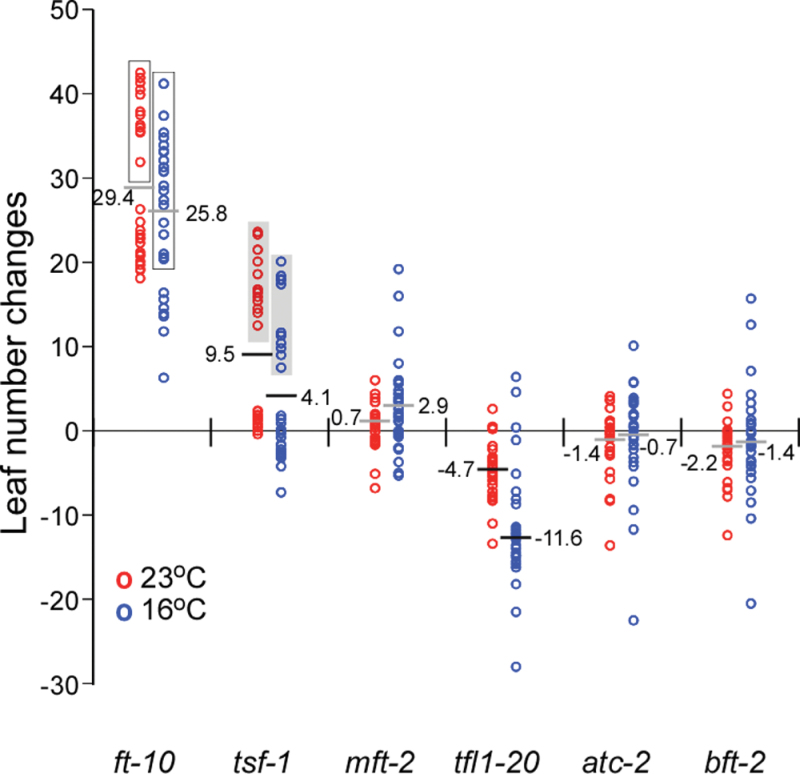
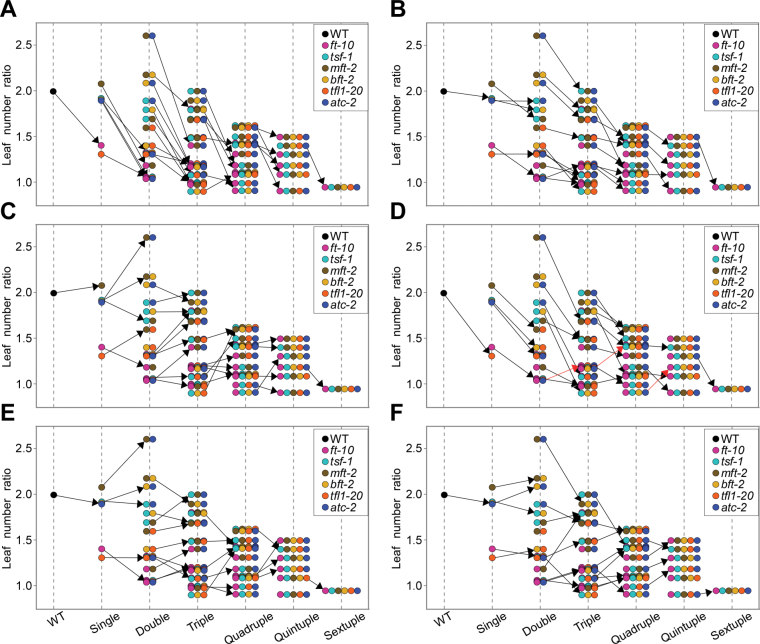
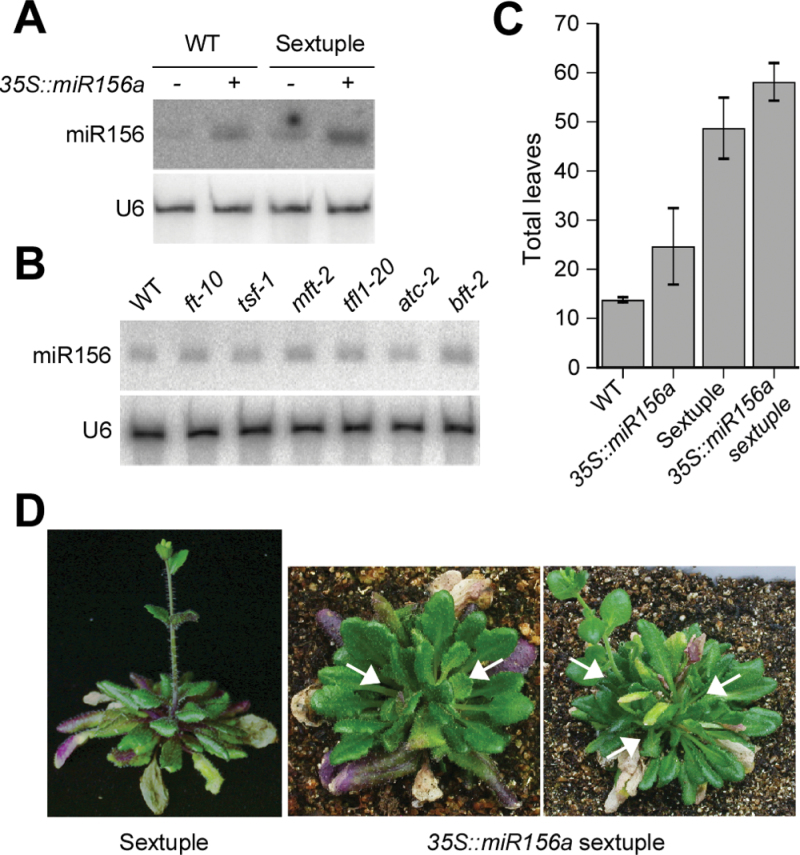
The FLOWERING LOCUS T (FT)/TERMINAL FLOWER 1 (TFL1) family proteins play an important role in the regulation of flowering time. In the Arabidopsis thaliana genome, there are six genes in the FT/TFL1 family. To determine how these FT/TFL1 family genes contribute to the regulation of flowering time, this study generated a comprehensive set of mutants (sixty-three multiple mutants in all combinations) of the FT/TFL1 family genes and analysed their flowering times at 23 and 16°C under long-day conditions. The analysis confirmed that FT and TFL1 are major determinants of flowering time under long-day conditions. At 23 °C, ft-10 tsf-1 mft-2 showed the latest flowering, whereas tfl1-20 atc-2 bft-2 showed the earliest flowering. Flowering occurred in the sextuple mutants. Introduction of tsf-1 led to reduced sensitivity to ambient temperature change. Introduction of tfl1-20 caused a stronger effect in accelerating flowering time at 16 °C than at 23 °C. Overexpression of miR156 did not block flowering of sextuple mutants, suggesting that there is a pathway to induce flowering independent of the FT/TFL1 pathway and miR156 pathway. This study proposes that this mutant population will be useful in further investigation of the functions of the FT/TFL1 family genes in plant development.


Figures

Fig. 1.
Fig. 1.
Map of T-DNA insertions of mutants used in this study and strategy for generating the mutant population. (A) T-DNA insertions in the FT/TFL1 family mutants used in this work. Closed boxes indicate exons; solid lines indicate introns; inverted triangles indicate T-DNA insertion. Both the allele name and its public T-DNA library identifier (Alonso et al., 2003; Rosso et al., 2003) are presented. (B) The strategy for generating a comprehensive set of mutants of the FT/TFL1 family genes. (C) Confirmation of the genotype of sextuple (ft-10 tsf-1 mft-2 tfl1-20 atc-2 bft-2) mutants by PCR. For example, ft-10 genotyping produced a single band of 926bp in size from the homozygous ft-10 allele (*), whereas the wild-type allele (WT, +) produced a single band of 1392bp in size. Genotyping primer information and the sizes of the expected amplicon of each mutant allele are provided in Table S1.
Fig. 2.
Fig. 2.
Expression levels of FT/TFL1 family genes in each single mutant determined via RT-qPCR: (A) FT, (B) TSF, (C) MFT, (D) TFL1, (E) ATC, and (F) BFT. Expression levels were normalized to At1G13320 and At2G28390 (Hong et al., 2010). Asterisks indicate near absence of transcript levels of the gene in the corresponding mutants.
Fig. 3.
Fig. 3.
Leaf number changes caused by the introduction of each mutation at 23 °C under long-day conditions. (A, C, E, G, I, and K) The effect of introducing ft-10 (A), tsf-1 (C), mft-2 (E), tfl1-20 (G), atc-2 (I), and bft-2 (K); the arrows indicate leaf number changes after addition of a certain mutation to a genotype. (B, D, F, H, J, and L) Leaf number changes caused by the introduction of a single mutation in mutants containing (+) or not containing (–) another mutation: (B) introduction of ft-10 into mutants with or without tsf-1; (D) introduction of tsf-1 into mutants with or without ft-10; (F) introduction of mft-2 into mutants with or without tfl1-20; (H) introduction of tfl1-20 into mutants with or without ft-10 tsf-1 atc-2; (J) introduction of atc-2 into mutants with or without ft-10; (L) introduction of bft-2 into mutants with or without ft-10.
Fig. 4.
Fig. 4.
Leaf number changes caused by the introduction of each mutation at 16 °C under long-day conditions. (A, C, E, F, G, and H) The effect of introducing ft-10 (A), tsf-1 (C), mft-2 (E), tfl1-20 (F), atc-2 (G), and bft-2 (H); the arrows indicate leaf number changes after addition of a certain mutation to a genotype. (B and D) Leaf number changes caused by the introduction of a single mutation in mutants containing (+) or not containing (–) another mutation: (B) introduction of ft-10 into mutants with or without tsf-1; (D) introduction of tsf-1 into ft-10.
Fig. 5.
Fig. 5.
Plotting of leaf number changes in all mutant combinations caused by introduction of each single mutation at 23 and 16°C. Open boxes indicate leaf number changes by ft-10 in the presence of tsf-1 (except ft-10 mft-2 bft-2 mutants at 16 °C). Grey boxes indicate leaf number changes caused by tsf-1 in the presence of ft-10 (except ft-10 tsf-1 mft-2 bft-2, ft-10 tsf-1 atc-2 bft-2, and ft-10 tsf-1 mft-2 tfl1-20 mutants at 16 °C). Horizontal bars indicate the average leaf number changes caused by the introduction of each mutation: note that tfl1-20 and tsf-1 caused a stronger effect at 16 °C than at 23 °C (black bars, P < 0.05), and that ft-10, mft-2, atc-2, and bft-2 did not show a clear effect (grey bars).
Fig. 6.
Fig. 6.
Changes in leaf number ratios (16 °C/23 °C) by the introduction of mutations ft-10 (A), tsf-1 (B), mft-2 (C), tfl1-20 (D), atc-2 (E), and bft-2(F). Arrows indicate the changes in leaf number ratios after addition of a certain mutation into a genotype.
Fig. 7.
Fig. 7.
Flowering phenotype of 35S::miR156a ft-10 tsf-1 mft-2 tfl1-20 atc-2 bft-2 mutants under long-day conditions. (A and B) Small RNA blots showing expression levels of miR156 in transgenic plants generated in this study (35S::miR156a plants and 35S::miR156a ft-10 tsf-1 mft-2 tfl1-20 atc-2 bft-2 mutants) (A) and in single mutants (B); U6 RNA served as a loading control (Lee et al., 2010). (C and D) Flowering time (C) and morphology (D) of 35S::miR156a ft-10 tsf-1 mft-2 tfl1-20 atc-2 bft-2 mutants under long-day conditions. Note multiple rosettes generated from 35S::miR156a ft-10 tsf-1 mft-2 tfl1-20 atc-2 bft-2 mutants (arrows). Total leaf number of ft-10 tsf-1 mft-2 tfl1-20 atc-2 bft-2 mutants in (C) came from Table 1.

Similar articles

Cited by

References

    1. Abe M, Kobayashi Y, Yamamoto S, Daimon Y, Yamaguchi A, Ikeda Y, Ichinoki H, Notaguchi M, Goto K, Araki T. 2005. FD, a bZIP protein mediating signals from the floral pathway integrator FT at the shoot apex. Science 309, 1052–1056 - PubMed
    1. Ahn JH, Miller D, Winter VJ, Banfield MJ, Lee JH, Yoo SY, Henz SR, Brady RL, Weigel D. 2006. A divergent external loop confers antagonistic activity on floral regulators FT and TFL1. The EMBO Journal 25, 605–614 - PMC - PubMed
    1. Alonso JM, Stepanova AN, Leisse TJ, et al. 2003. Genome-wide insertional mutagenesis of Arabidopsis thaliana. Science 301, 653–657 - PubMed
    1. Blazquez MA, Ahn JH, Weigel D. 2003. A thermosensory pathway controlling flowering time in Arabidopsis thaliana. Nature Genetics 33, 168–171 - PubMed
    1. Bradley D, Ratcliffe O, Vincent C, Carpenter R, Coen E. 1997. Inflorescence commitment and architecture in Arabidopsis. Science 275, 80–83 - PubMed

Publication types

MeSH terms