. 2013;8(2):e55411.
doi: 10.1371/journal.pone.0055411. Epub 2013 Feb 6.

Inhibition of apoplastic calmodulin impairs calcium homeostasis and cell wall modeling during Cedrus deodara pollen tube growth

Affiliations

Inhibition of apoplastic calmodulin impairs calcium homeostasis and cell wall modeling during Cedrus deodara pollen tube growth

Li Wang et al. PLoS One. 2013.

Abstract

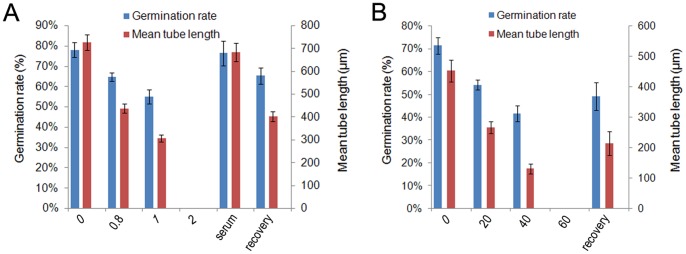
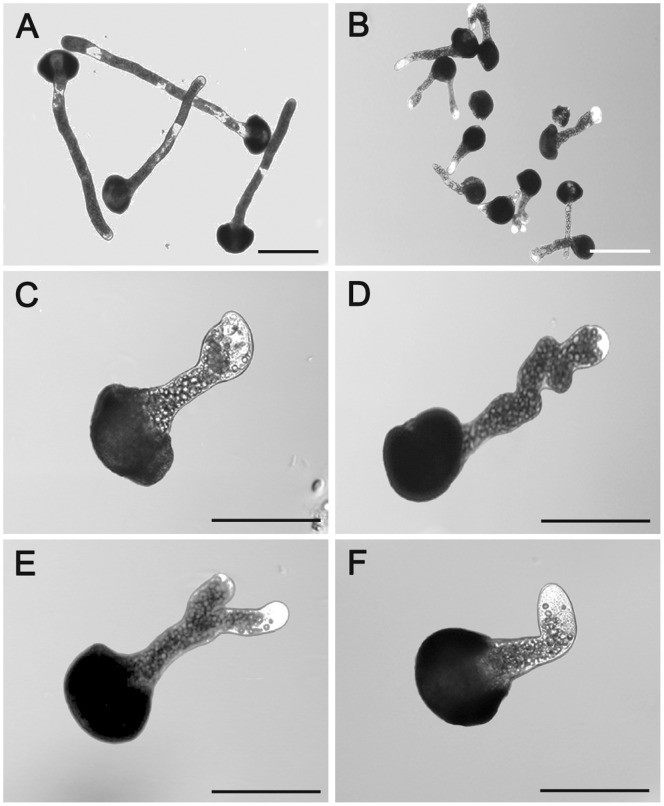
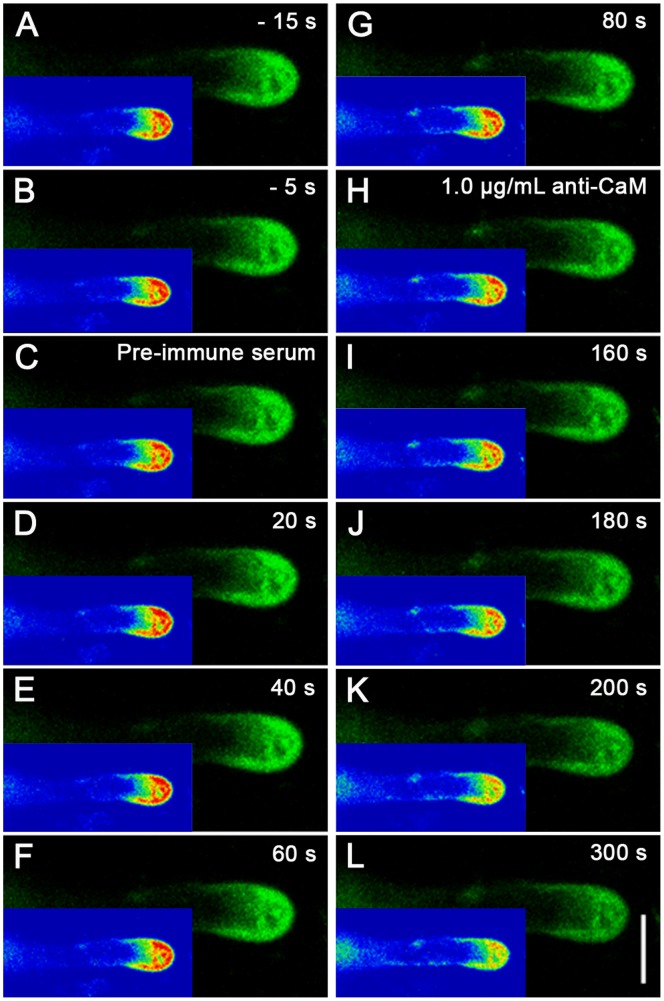
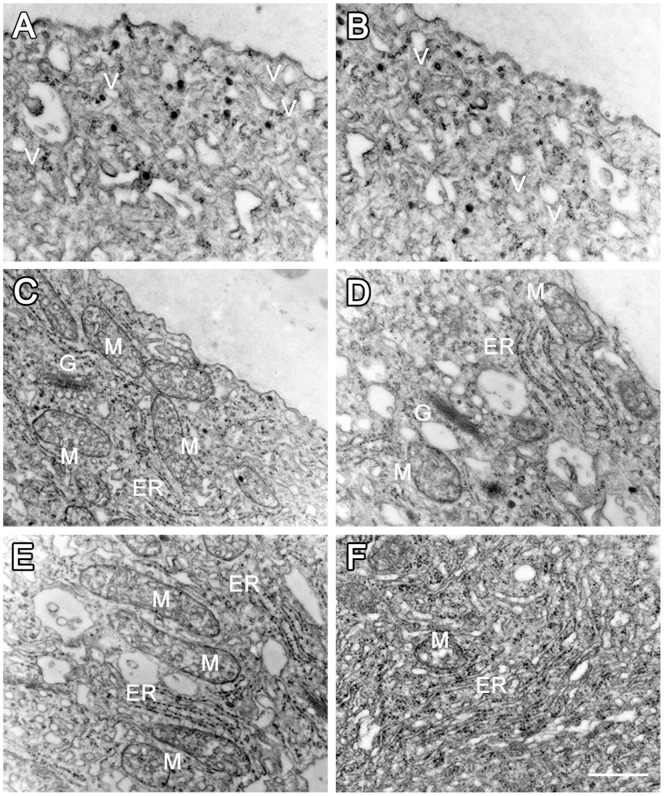
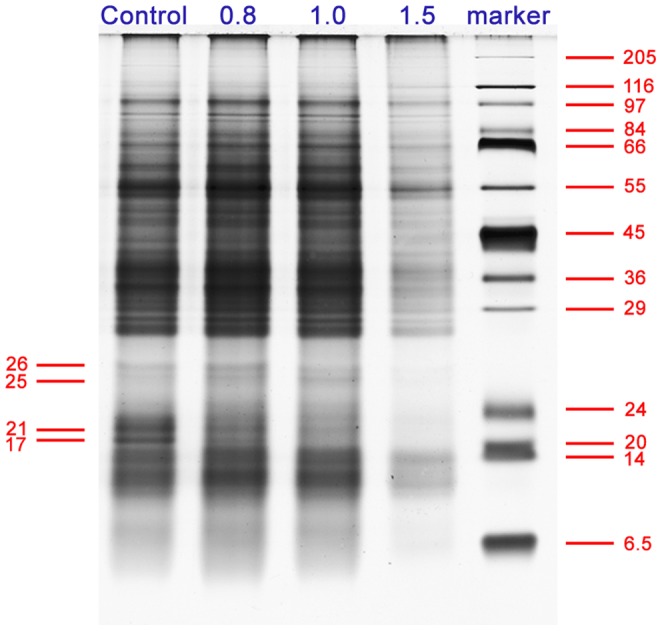
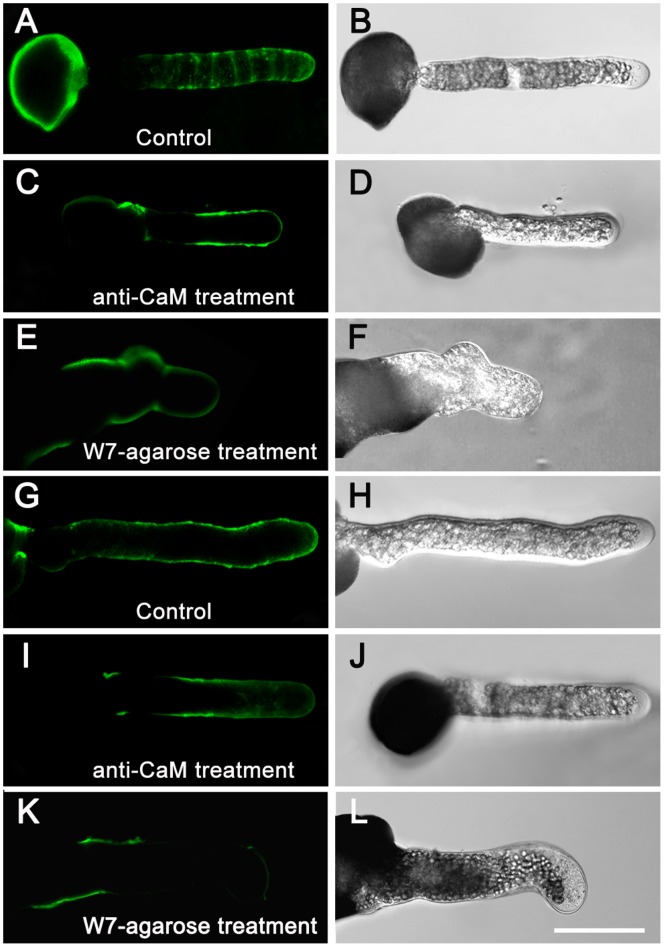
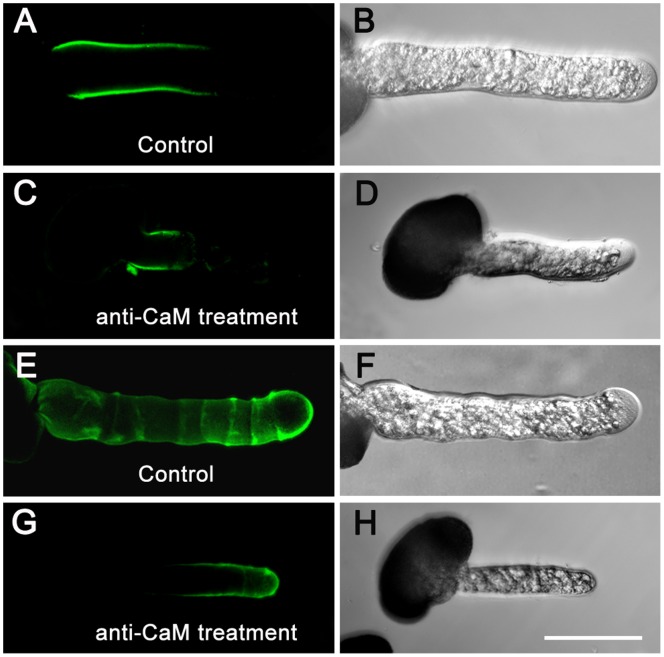
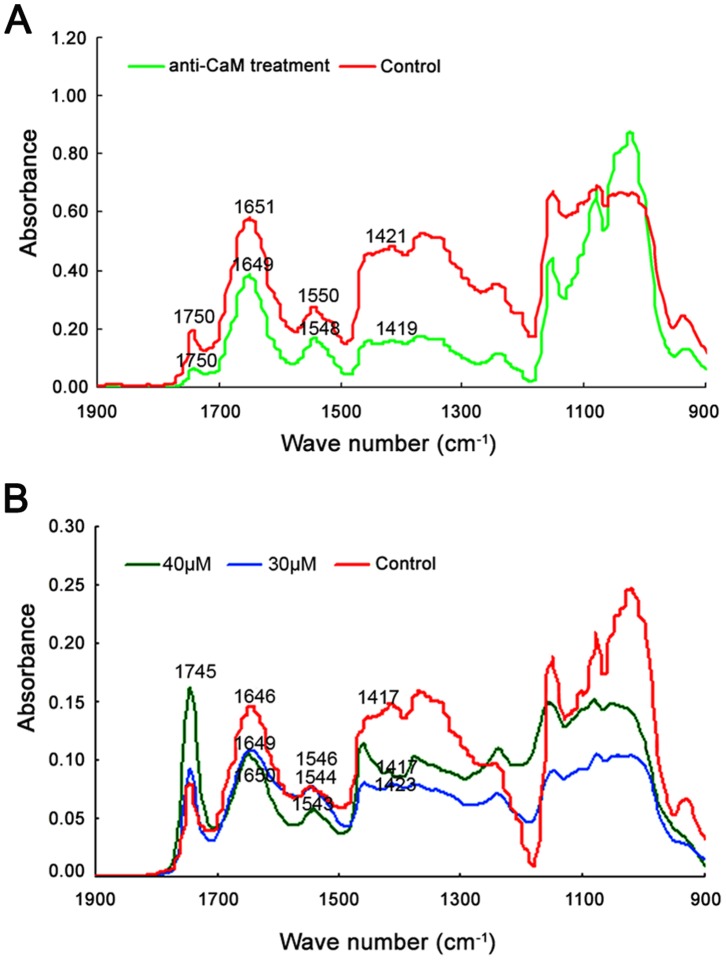
Calmodulin (CaM) is one of the most well-studied Ca(2+) transducers in eukaryotic cells. It is known to regulate the activity of numerous proteins with diverse cellular functions; however, the functions of apoplastic CaM in plant cells are still poorly understood. By combining pharmacological analysis and microscopic techniques, we investigated the involvement of apoplastic CaM in pollen tube growth of Cedrus deodara (Roxb.) Loud. It was found that the tip-focused calcium gradient was rapidly disturbed as one of the early events after application of pharmacological agents, while the cytoplasmic organization was not significantly affected. The deposition and distribution of acidic pectins and esterified pectins were also dramatically changed, further perturbing the normal modeling of the cell wall. Several protein candidates from different functional categories may be involved in the responses to inhibition of apoplastic CaM. These results revealed that apoplastic CaM functions to maintain the tip-focused calcium gradient and to modulate the distribution/transformation of pectins during pollen tube growth.


Conflict of interest statement

Competing Interests: The authors have declared that no competing interests exist.

Figures

Figure 1
Figure 1. Inhibitory effects of anti-CaM and W7-agarose on pollen germination and pollen tube growth.
A, Inhibitory effect of anti-CaM on pollen germination and tube elongation. Numbers on X-axis indicate concentrations of anti-CaM. Pollen tubes incubated in the presence of 1 µg/mL anti-CaM were collected to remove the pharmacological agent, then pollen tubes were further incubated in standard medium for recovery tests before statistical analysis. B, Inhibitory effect of W7-agarose on pollen germination and tube elongation. Numbers on X-axis indicate concentrations of W7-agarose. Pollen tubes incubated in the presence of 40 µM W7-agarose were collected to remove the pharmacological agent, then pollen tubes were further incubated in standard medium for recovery tests before statistical analysis.
Figure 2
Figure 2. Abnormal morphology of Cedrus deodara pollen tubes induced by 20 µM W7-agarose treatment.
A, Untreated pollen tubes incubated in standard medium. B–F, Pollen tubes incubated with 20 µM W7-agarose. C, Tube with swollen tip. D: Twisted tube. E: Branched tube. F: Bent tube. A–B: Bar = 200 µm; C–F: Bar = 100 µm.
Figure 3
Figure 3. Time course analysis of [Ca2+]c changes upon anti-CaM treatment.
Calcium Green-1 Dextran microinjection was carried out to further elucidate changes in calcium gradient upon addition of anti-CaM. Calcium Green-1 dextran (2.5 mM in 5 mM HEPES buffer, pH 7.0) was pressure-injected into pollen tubes. Ca2+ dynamics in injected pollen tubes were recorded using a LSM 510 META LSCM (Zeiss Co., Germany) in time-course mode (488 nm excitation laser and 525/550 nm band pass emission filter). A–B, Before time-series recording, two single images were captured at 10-s interval to examine fluorescence. C–G, Ca2+ distribution in injected pollen tubes did not change significantly after application of pre-immune serum at 0 s. H–L, Ca2+ gradient dissipated after addition of 1.0 µg/mL anti-CaM at 100 s during time-course recording. Corresponding rainbow mode images are shown in bottom left corner of each image panel. Bar = 20 µm. Injection, image collection, and subsequent data analysis was carried out for five to seven pollen tubes.
Figure 4
Figure 4. TEM analysis of cytoplasmic organization and organelle ultrastructure after anti-CaM treatment.
A, Tip region of control pollen tube with abundant vesicles. B, Tip region in pollen tube after anti-CaM treatment, showing no obvious change in cytoplasmic organization. C, Mitochondria with electron-dense matrix and well-developed cristae in control pollen tube. D, Mitochondria without obvious abnormalities in ultrastructure upon anti-CaM treatment. E, Flat, tightly packed ERs with many attached ribosomes in control pollen tube. F, ERs with fewer attached ribosomes after anti-CaM treatment. Bar = 0.5 µm; G, Golgi stack; M, mitochondria; V, vesicle; ER, endoplasmic reticulum.
Figure 5
Figure 5. Protein expression profiles of Cedrus deodara pollen tubes cultured in the presence of different concentrations of anti-CaM (µg/mL).
Proteins were extracted from pollen tubes incubated in standard medium (control) and in media containing 0.8, 1.0, or 1.5 µg/mL anti-CaM. Equivalent protein samples were separated by SDS-PAGE electrophoresis on 12% polyacrylamide gels (1 mm thick). Four bands showing significant changes in their expression levels were excised and subjected to further MS identification.
Figure 6
Figure 6. Variations in distribution and deposition of JIM5- and JIM7-reactive pectins after anti-CaM and W7-agarose treatments.
Immunolabeling of pectins in pollen tube wall was carried out following the procedures described by Derksen (1999) with slight modifications. Pollen tubes were fixed and incubated in JIM5 and JIM7 as the primary antibody, and then incubated with FITC-labeled sheep anti-rat IgG as the secondary antibody. Samples were mounted and photographed under LSCM (excitation, 488 nm; emission, 522 nm). Controls were prepared by omitting the primary antibody. Samples consisted of 50 µL cultured pollen tubes (1 mg/mL at beginning of pollen culture) for immunofluorescence labeling experiments (repeated for three cultured sample bulks), of which five to nine pollen tubes were used for image collection and subsequent data analysis. A–B, JIM5-reactive pectins deposited in characteristic ring-like pattern along tube shank in control pollen tubes. C–D, JIM5-reactive pectins showed enhanced deposition along tube shank but slightly decreased deposition in apex, and characteristic ring-like deposition was no longer detected after anti-CaM application. E–F, W7-agarose application abolished characteristic ring-like deposition of JIM5-reactive pectins. G–H, JIM7-reactive pectins distributed almost uniformly along whole length of control pollen tubes. I–J, JIM7-reactive pectins displayed uneven distribution along the tube wall and fluorescence at the apex was relatively weak after anti-CaM treatment. K–L, Fluorescence of JIM7-reactive pectins was localized to confined region at basal site and only weak signal was detected at tip region after W7-agarose treatment. Bar = 50 µm.
Figure 7
Figure 7. Deposition of LM2- and LM6-reactive AGPs in control and anti-CaM-treated pollen tubes.
Immunolabeling of AGPs in pollen tube wall and subsequent image collection were carried out following procedures for pectin labeling except that LM2 and LM6 were used as primary antibodies. Pollen tubes were mounted and photographed under an LSCM (excitation, 488 nm; emission, 522 nm). Controls were prepared by omitting primary antibody. Samples consisted of 50 µL cultured pollen tubes (1 mg/mL at beginning of pollen culture) for immunofluorescence labeling experiments (repeated for three cultured sample bulks), of which five to nine pollen tubes were used for image collection and subsequent data analysis. A–B, Increasing gradient of LM2-reactive AGPs from subapical region to basal part of control pollen tubes. C–D, Fluorescence of LM2-reactive AGPs gradient was confined to basal part and did not extend further toward tip after anti-CaM treatment. E–F, LM6-reactive AGPs distributed in characteristic ring-like pattern similar to that of JIM5-reactive pectins along entire tube length of control pollen tubes. G–H, LM6-reactive AGPs were detected along tube shank and tip region after anti-CaM treatment, but characteristic ring-like pattern was abolished. Bar = 50 µm.
Figure 8
Figure 8. Fourier transform infrared spectra obtained from tip regions of Cedrus deodara pollen tubes.
Three spectra were collected from each sample, and then averaged and baseline-corrected. Triplicate-averaged spectra were used to prepare figures shown in panels. A, FTIR spectra obtained from tip regions of pollen tubes incubated in the presence of 1.5 µg/mL anti-CaM. B, FTIR spectra obtained from tip regions of pollen tubes incubated in the presence of 30 and 40 µM W7-agarose. FTIR spectra showed that esterified pectins (saturated ester at 1745 cm−1) increased in tube wall while acidic pectins (carboxylic acid at 1415 cm−1) substantially decreased after treatments with pharmacological agents.

Similar articles

Cited by

References

    1. Feijó JA, Costa SS, Prado AM, Becker JD, Certal AC (2004) Signaling by tips. Curr Opin Plant Biol 7: 589–598. - PubMed
    1. Krichevsky A, Kozlovsky SV, Tian GW, Chen MH, Zaltsman A, et al. (2007) How pollen tube grow. Dev Biol 303: 405–420. - PubMed
    1. Crocker G, Dawson RA, Barton CH, MacNeil S (1988) An extracellular role for calmodulin-like activity in cell proliferation. Biochem J 253: 877–884. - PMC - PubMed
    1. Boynton AL, Whitfield JF, MacManus JP (1980) Calmodulin stimulating DNA synthesis by rat live cells. Biochem Bioph Res Co 95: 745–749. - PubMed
    1. Bowler C, Chua NH (1994) Emerging themes of plant signal transduction. Plant Cell 6: 1529–1541. - PMC - PubMed

Publication types

LinkOut - more resources