. 2013:3:1175.
doi: 10.1038/srep01175. Epub 2013 Feb 6.

Monitoring the presence of ionic mercury in environmental water by plasmon-enhanced infrared spectroscopy

Affiliations

Monitoring the presence of ionic mercury in environmental water by plasmon-enhanced infrared spectroscopy

Chung V Hoang et al. Sci Rep. 2013.

Abstract

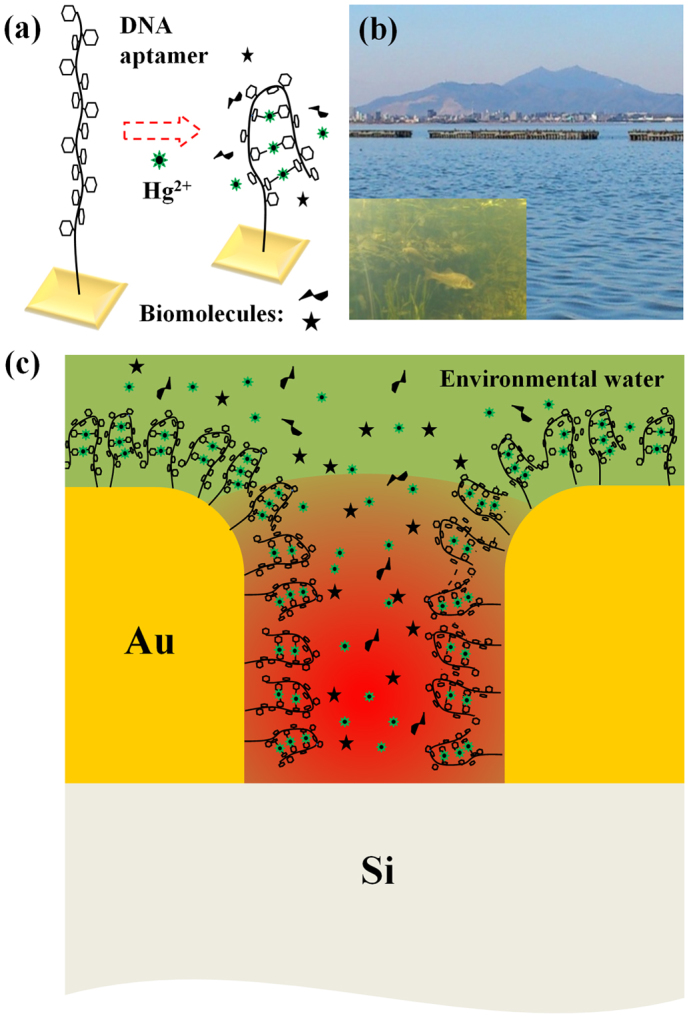
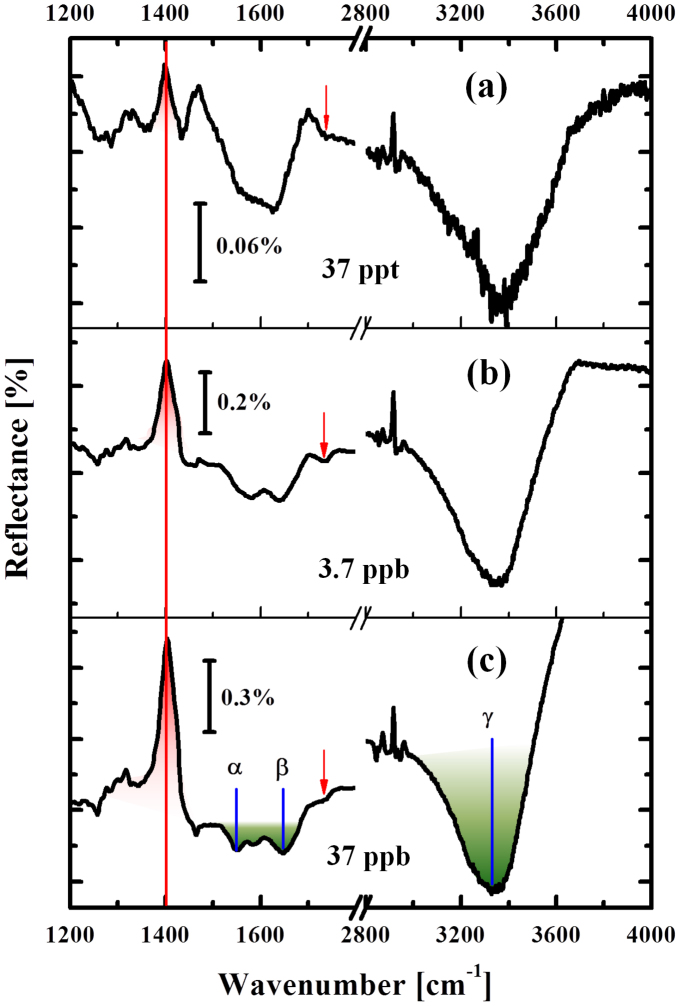
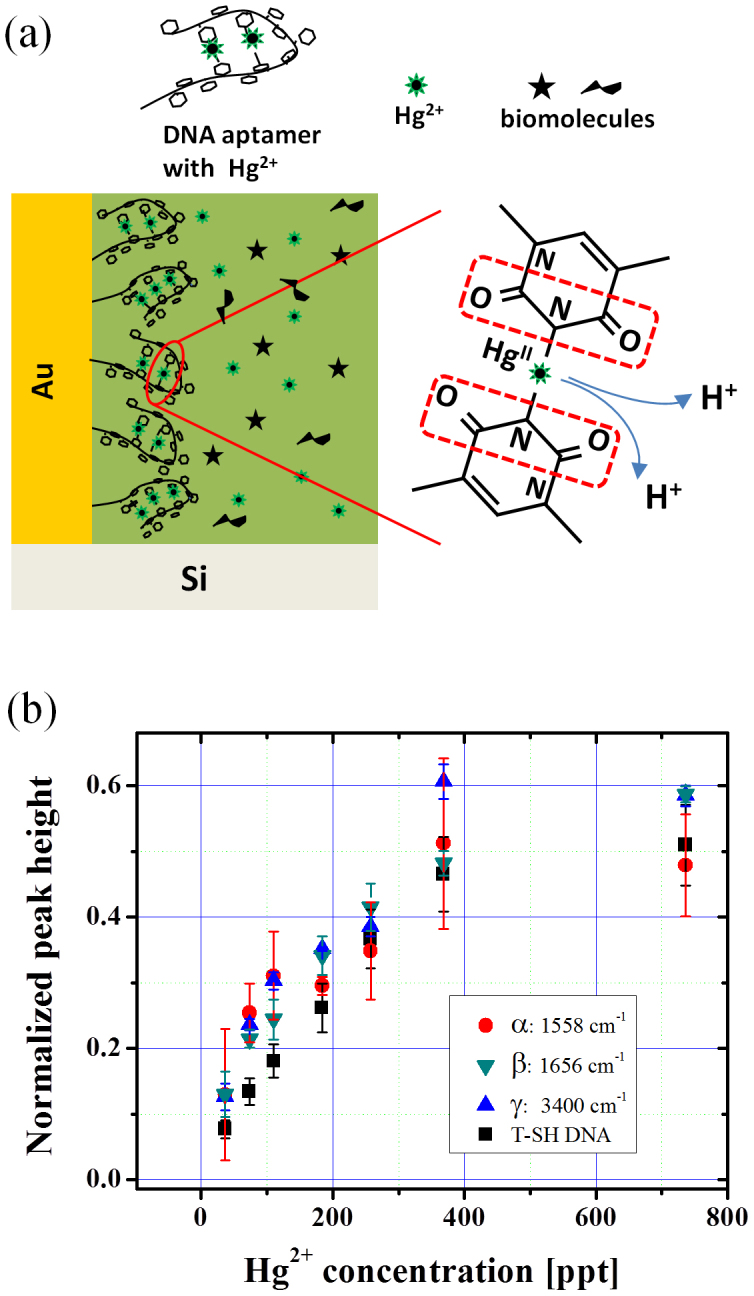
We demonstrate the ppt-level single-step selective monitoring of the presence of mercury ions (Hg²⁺) dissolved in environmental water by plasmon-enhanced vibrational spectroscopy. We combined a nanogap-optimized mid-infrared plasmonic structure with mercury-binding DNA aptamers to monitor in-situ the spectral evolution of the vibrational signal of the DNA induced by the mercury binding. Here, we adopted single-stranded thiolated 15-base DNA oligonucleotides that are immobilized on the Au surface and show strong specificity to Hg²⁺. The mercury-associated distinct signal is located apart from the biomolecule-associated broad signals and is selectively characterized. For example, with natural water from Lake Kasumigaura (Ibaraki Prefecture, Japan), direct detection of Hg²⁺ with a concentration as low as 37 ppt (37 × 10⁻¹⁰%) was readily demonstrated, indicating the high potential of this simple method for environmental and chemical sensing of metallic species in aqueous solution.


Figures

Figure 1
Figure 1. Mechanism for infrared plasmonic sensing of mercury ions.
(a) Schematic of the mercury trapping by a DNA aptamer. A Hg2+ ion bridges two thymine bases (small hexagons) and forms N-Hg-N bonds leading to the conformational change of the DNA. (b) A photo of Lake Kasumigaura and subaqueous environment. (c) Schematic of the EM field-enhancement in the Au nanogap (typical gap-size of about 10 nm) with the presence of DNA aptamers on the plasmonic substrate. Structural and chemical changes in these DNA owing to the adsorption of Hg2+ ions lead to the modification in the optical spectrum, which later plays as a mechanism for the detection of mercury ions.
Figure 2
Figure 2. Experimental and simulated spectra on the optical property of the plasmonic Au nanogap network.
On the left: three typical scanning electron microscope (SEM) images of the gold nanostructures, taken at different growth stages, scale bar: 200 nm. Those SEM pictures are used as models for the rigorous coupled wave analysis (RCWA) simulations. (a): A comparison of the simulated spectra (adopting the blue frame SEM) and the measured IR reflectance of the samples whose morphology is similar to that of the SEM pictures in the left. (b): Experimental time evolution of the IR spectra measured in-situ during the growth of the AuNP. (c): RCWA simulations of the three growth stages (SEM images in the left) in the presence of water in the nanogaps. The increase of the spectral coupling between the water vibration and the plasmonic excitation of the Au nanostructure could be identified accordingly from the distorted feature of the water bands. The color of each spectrum in (b) and (c) corresponds to each growth stage represented by the SEM images with the same color on the frame.
Figure 3
Figure 3. IR spectra from DNA aptamers.
(a) and (b): The relative IR spectra of DNA on AuNP plasmonic structure in pure water under different polarization conditions, s-polarization (a) and p-polarization (b). (c) Measurement performed in sampled water from Lake Kasumigaura. The red and blue features indicate vibrational signals from the DNA and residual biomolecules from Lake Kasumigaura, respectively. Schematic on the right of each graph shows the corresponding depiction of the measurements.
Figure 4
Figure 4. Detection of the presence of ionic mercury in environmental water.
Spectral evolution shown as a function of Hg2+ concentration (added into water of Lake Kasumigaura). DNA-related signal is indicated by red peak and small red arrows. Green absorption feature shows the residual biomolecules in the lake water. Note that the scale of reflectance is different for each sub-graph.
Figure 5
Figure 5
(a) Schematic of the structural deformation of DNA owing to the bridge-site adsorption of Hg2+ in the presence of different biomolecules occupying the in-gap space near the folded DNA. Two thymine bases are bridged by an Hg2+ ion after releasing two imino protons. Subsequently the neighboring bonds around the N atoms in the imide structures (marked by red dotted frame) will modify its dipole moment and gives rise to the IR signal change. (b) Evolution of the intensity of the DNA peak (related to the imide bond in thymine) at ω = 1400 cm−1 and biomolecule-related ones at α: 1558 cm−1, β: 1650 cm−1 and γ: 3300 cm−1, by varying the Hg2+ concentration.

References

    1. Nolan E. M. & Lippard S. J. Tools and tactics for the optical detection of mercuric ion. Chem. Rev. 108, 3443–3480 (2008). - PubMed
    1. Ministry of the environment, Japan. "Mercury analysis manual". National Institute for Minamata Disease website; http://www.nimd.go.jp/english/kenkyu/docs/2004_march_mercury_analysis_ma... Date of access: October32012.
    1. Cao R. G., Zhu B., Li J. & Xu D. Oligonucleotides-based biosensors with high sensitivity and selectivity for mercury using electrochemical impedance spectroscopy. Electrochem. Commun. 11, 1815–1818 (2009).
    1. Miyake Y., Togashi H., Tashiro M., Yamaguchi H., Oda S., Kudo M., Tanaka Y., Kondo Y., Sawa Y., Fujimoto T., Machinami T. & Ono A. MercuryII-mediated formation of thymine−HgII−thymine base pairs in DNA duplexes. J. Am. Chem. Soc. 128, 2172–2173 (2006). - PubMed
    1. Yang Y. -K., Yook, K.-J. & Tae, J. A rhodamine-based fluorescent and colorimetric chemodosimeter for the rapid detection of Hg2+ ions in aqueous media. J. Am. Chem. Soc. 127, 16760–16761 (2005). - PubMed

Publication types