

Two-dimensional nanostructure-reinforced biodegradable polymeric nanocomposites for bone tissue engineering
- PMID: 23405887
- PMCID: PMC3601907
- DOI: 10.1021/bm301995s
Two-dimensional nanostructure-reinforced biodegradable polymeric nanocomposites for bone tissue engineering
Abstract
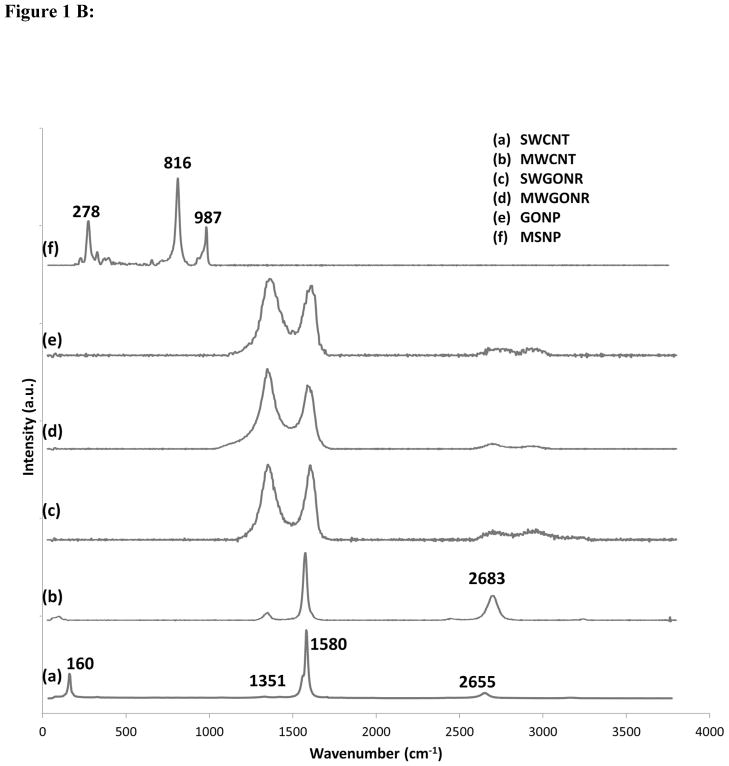
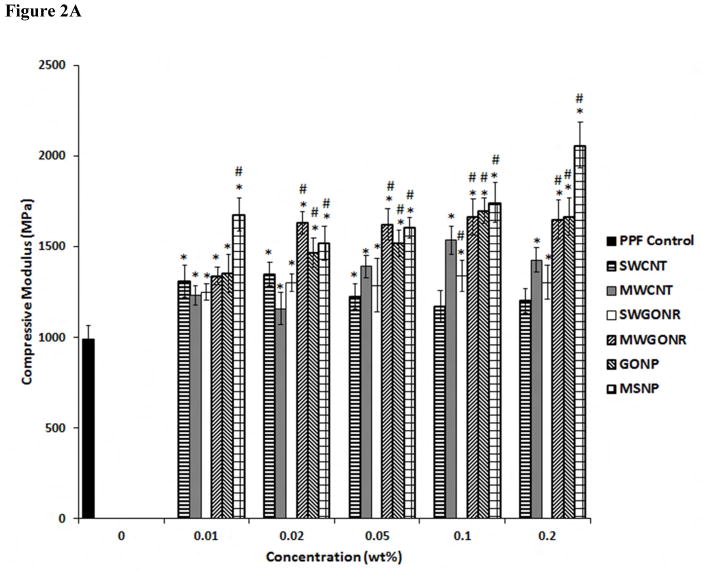
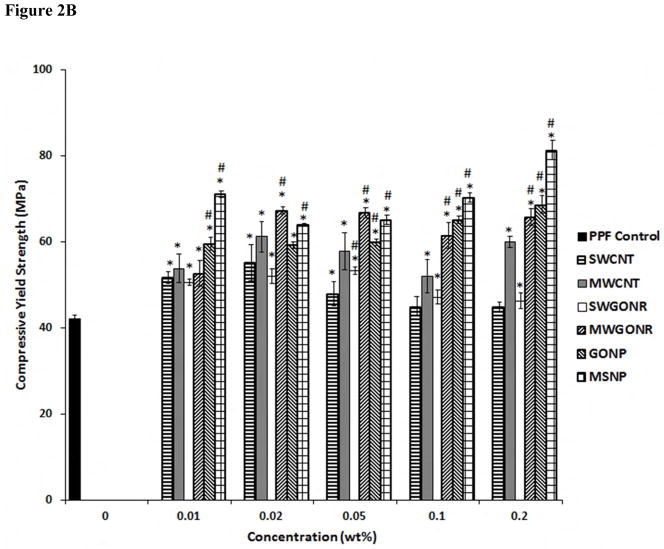
This study investigates the efficacy of two-dimensional (2D) carbon and inorganic nanostructures as reinforcing agents for cross-linked composites of the biodegradable and biocompatible polymer polypropylene fumarate (PPF) as a function of nanostructure concentration. PPF composites were reinforced using various 2D nanostructures: single- and multiwalled graphene oxide nanoribbons (SWGONRs, MWGONRs), graphene oxide nanoplatelets (GONPs), and molybdenum disulfide nanoplatelets (MSNPs) at 0.01-0.2 weight% concentrations. Cross-linked PPF was used as the baseline control, and PPF composites reinforced with single- or multiwalled carbon nanotubes (SWCNTs, MWCNTs) were used as positive controls. Compression and flexural testing show a significant enhancement (i.e., compressive modulus = 35-108%, compressive yield strength = 26-93%, flexural modulus = 15-53%, and flexural yield strength = 101-262% greater than the baseline control) in the mechanical properties of the 2D-reinforced PPF nanocomposites. MSNP nanocomposites consistently showed the highest values among the experimental or control groups in all the mechanical measurements. In general, the inorganic nanoparticle MSNP showed a better or equivalent mechanical reinforcement compared to carbon nanomaterials, and 2D nanostructures (GONPs, MSNPs) are better reinforcing agents compared to one-dimensional (1D) nanostructures (e.g., SWCNTs). The results also indicated that the extent of mechanical reinforcement is closely dependent on the nanostructure morphology and follows the trend nanoplatelets > nanoribbons > nanotubes. Transmission electron microscopy of the cross-linked nanocomposites indicated good dispersion of nanomaterials in the polymer matrix without the use of a surfactant. The sol-fraction analysis showed significant changes in the polymer cross-linking in the presence of MSNP (0.01-0.2 wt %) and higher loading concentrations of GONP and MWGONR (0.1-0.2 wt %). The analysis of surface area and aspect ratio of the nanostructures taken together with the above results indicated differences in nanostructure architecture (2D vs 1D nanostructures), and the chemical compositions (inorganic vs carbon nanostructures), number of functional groups, and structural defects for the 2D nanostructures may be key properties that affect the mechanical properties of 2D nanostructure-reinforced PPF nanocomposites and the reason for the enhanced mechanical properties compared to the controls.
Figures


References
-
- Dinopoulos H, Dimitriou R, Giannoudis PV. Bone graft substitutes: What are the options? Surgeon. 2012;10(4):230–9. - PubMed
-
- Sitharaman B, Shi X, Walboomers XF, Liao H, Cuijpers V, Wilson LJ, Mikos AG, Jansen JA. In vivo biocompatibility of ultra-short single-walled carbon nanotube/biodegradable polymer nanocomposites for bone tissue engineering. Bone. 2008;43(2):362–70. - PubMed
-
- Sitharaman B, Shi X, Tran LA, Spicer PP, Rusakova I, Wilson LJ, Mikos AG. Injectable in situ cross-linkable nanocomposites of biodegradable polymers and carbon nanostructures for bone tissue engineering. J Biomater Sci Polym Ed. 2007;18(6):655–71. - PubMed
-
- Shi X, Hudson JL, Spicer PP, Tour JM, Krishnamoorti R, Mikos AG. Rheological behaviour and mechanical characterization of injectable poly(propylene fumarate)/single-walled carbon nanotube composites for bone tissue engineering. Nanotechnology. 2005;16(7):S531–8. - PubMed
Publication types
MeSH terms
Substances
Grants and funding
LinkOut - more resources
Full Text Sources
Other Literature Sources
