. 2013 Mar-Apr;5(2):297-305.
doi: 10.4161/mabs.23684. Epub 2013 Feb 13.

Antibody biodistribution coefficients: inferring tissue concentrations of monoclonal antibodies based on the plasma concentrations in several preclinical species and human

Affiliations

Antibody biodistribution coefficients: inferring tissue concentrations of monoclonal antibodies based on the plasma concentrations in several preclinical species and human

Dhaval K Shah et al. MAbs. 2013 Mar-Apr.

Abstract

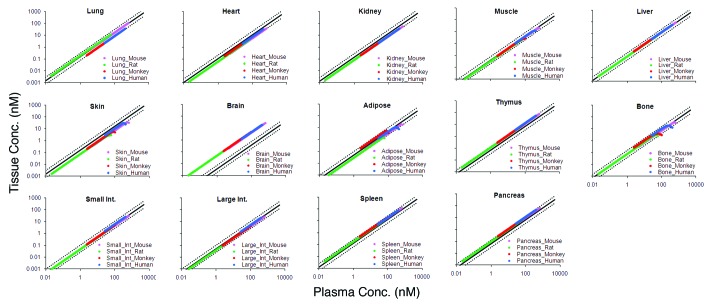
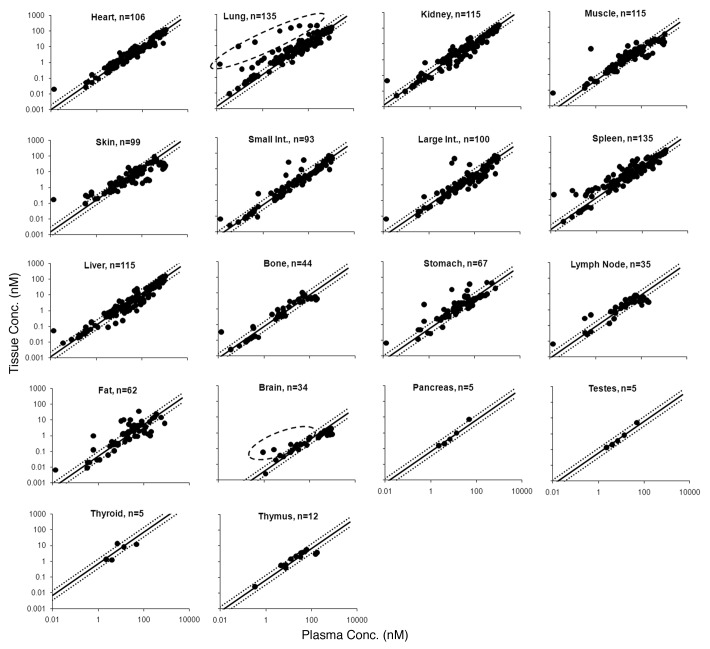
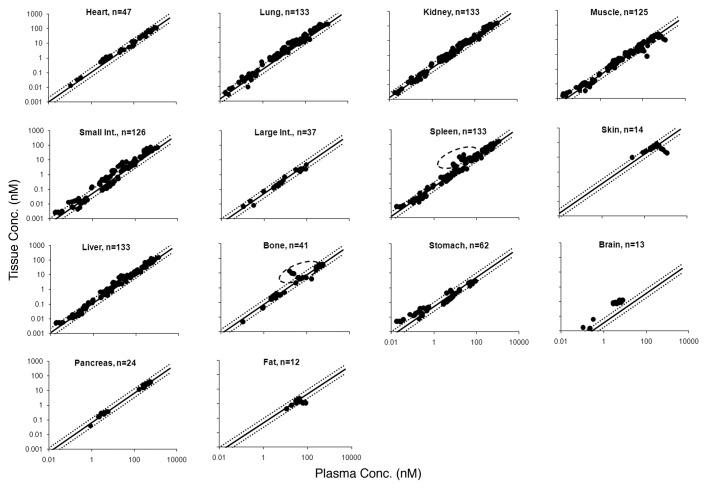
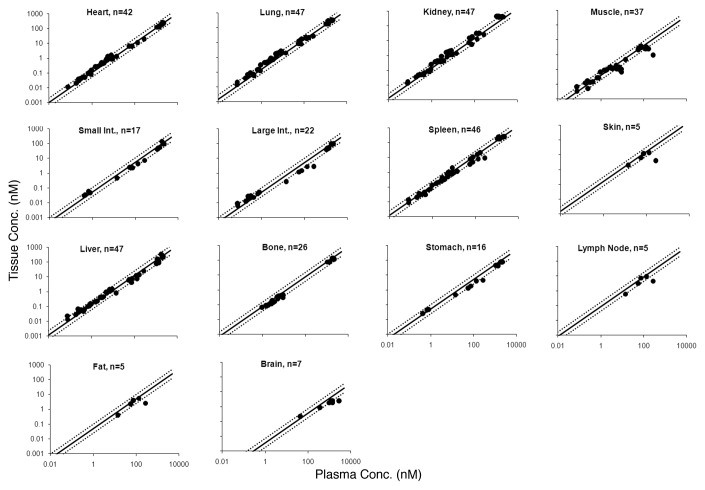
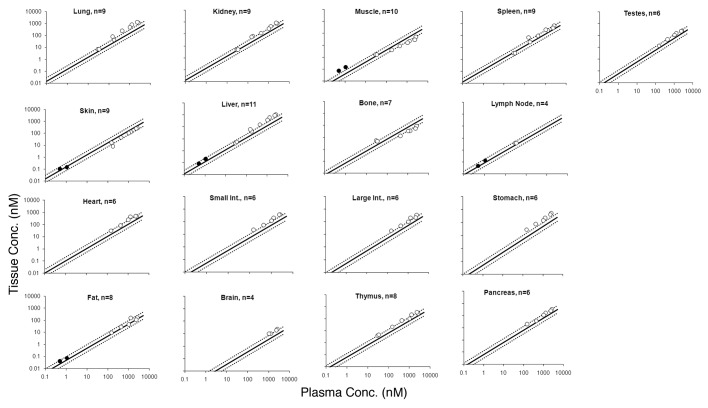
Tissue vs. plasma concentration profiles have been generated from a physiologically-based pharmacokinetic model of monoclonal antibody (mAb). Based on the profiles, we hypothesized that a linear relationship between the plasma and tissue concentrations of non-binding mAbs could exist; and that the relationship may be generally constant irrespective of the absolute mAb concentration, time, and animal species being analyzed. The hypothesis was verified for various tissues in mice, rat, monkey, and human using mAb or antibody-drug conjugate tissue distribution data collected from diverse literature. The relationship between the plasma and various tissue concentrations was mathematically characterized using the antibody biodistribution coefficient (ABC). Estimated ABC values suggest that typically the concentration of mAb in lung is 14.9%, heart 10.2%, kidney 13.7%, muscle 3.97%, skin 15.7%, small intestine 5.22%, large intestine 5.03%, spleen 12.8%, liver 12.1%, bone 7.27%, stomach 4.98%, lymph node 8.46%, adipose 4.78%, brain 0.351%, pancreas 6.4%, testes 5.88%, thyroid 67.5% and thymus is 6.62% of the plasma concentration. The validity of using the ABC to predict mAb concentrations in different tissues of mouse, rat, monkey, and human species was evaluated by generating validation data sets, which demonstrated that predicted concentrations were within 2-fold of the observed concentrations. The use of ABC to infer tissue concentrations of mAbs and related molecules provides a valuable tool for investigating preclinical or clinical disposition of these molecules. It can also help eliminate or optimize biodistribution studies, and interpret efficacy or toxicity of the drug in a particular tissue.

Keywords: ABC; ADC; Antibody Drug Conjugates; Antibody biodistribution coefficient; Monoclonal antibody; Tissue distribution; Tissue vs. plasma concentration.


Figures

None
Figure 1. The figure shows tissue vs. plasma mAb concentration profiles for several tissues. For each tissue the PBPK model simulated profiles for mouse (pink), rat (green), monkey (red), and human (blue) are provided. The black solid line in each tissue panel is the relationship based on the estimated ABC value for the respective tissue, and black dotted lines around the solid line represent the 2-fold error envelop.
None
Figure 2. Tissue vs. plasma mAb concentration profiles generated from the mouse training data set are shown. Black solid circles represent the observed data, and the black solid line in each tissue panel is the fitted line based on the estimated ABC value. Black dotted lines around the solid line represent the 2-fold error envelop. The black dashed circle around the data points for lung and brain highlights the distribution of antigen specific mAb in antigen positive tissues. The ‘n’ value in each panel displays the number of observed data points for each tissue.
None
Figure 3. Tissue vs. plasma mAb concentration profiles generated from the mouse validation data set are shown. Black solid circles represents the observed data, the black solid line represents the profile generated based on the estimated ABC values, and black dotted lines around the solid line represent the 2-fold error envelop. The ‘n’ value in each panel displays the number of observed data points for each tissue. The black dashed circle around the data points for bone and spleen highlights the distribution of mAb that was labeled with zirconium.
None
Figure 4. Tissue vs. plasma mAb concentration profiles generated from the rat validation data set are shown. Black solid dots represents the observed data, the black solid line represents the profile generated based on the mouse estimated ABC values, and black dotted lines around the solid line represent the 2-fold error envelop. The ‘n’ value in each panel displays the number of observed data points for each tissue.
None
Figure 5. The figure displays the tissue vs. plasma mAb concentration profiles generated from the monkey and human combined validation data set. Black open circles represents monkey and the black solid circles represents human observed data. Black solid line represents the profile generated based on the mouse estimated ABC values and black dotted lines around the solid line represent the 2-fold error envelop. The ‘n’ value in each panel displays the number of observed data points for each tissue.

References

    1. Shah DK, Betts AM. Towards a platform PBPK model to characterize the plasma and tissue disposition of monoclonal antibodies in preclinical species and human. J Pharmacokinet Pharmacodyn. 2012;39:67–86. doi: 10.1007/s10928-011-9232-2. - DOI - PubMed
    1. Tanaka C, Kawai R, Rowland M. Physiologically based pharmacokinetics of cyclosporine A: reevaluation of dose-nonlinear kinetics in rats. J Pharmacokinet Biopharm. 1999;27:597–623. doi: 10.1023/A:1020978509566. - DOI - PubMed
    1. Lobo ED, Hansen RJ, Balthasar JP. Antibody pharmacokinetics and pharmacodynamics. J Pharm Sci. 2004;93:2645–68. doi: 10.1002/jps.20178. - DOI - PubMed
    1. Wang W, Wang EQ, Balthasar JP. Monoclonal antibody pharmacokinetics and pharmacodynamics. Clin Pharmacol Ther. 2008;84:548–58. doi: 10.1038/clpt.2008.170. - DOI - PubMed
    1. Garg A, Balthasar JP. Physiologically-based pharmacokinetic (PBPK) model to predict IgG tissue kinetics in wild-type and FcRn-knockout mice. J Pharmacokinet Pharmacodyn. 2007;34:687–709. doi: 10.1007/s10928-007-9065-1. - DOI - PubMed

Substances