

Quantitative genetic-interaction mapping in mammalian cells
- PMID: 23407553
- PMCID: PMC3641890
- DOI: 10.1038/nmeth.2398
Quantitative genetic-interaction mapping in mammalian cells
Abstract
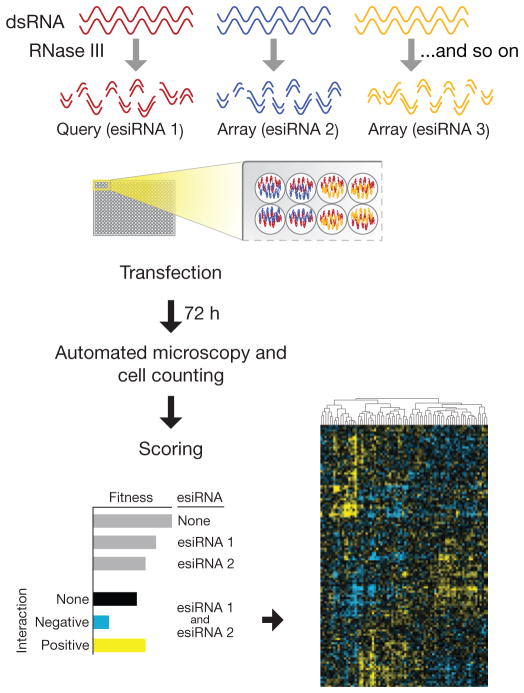
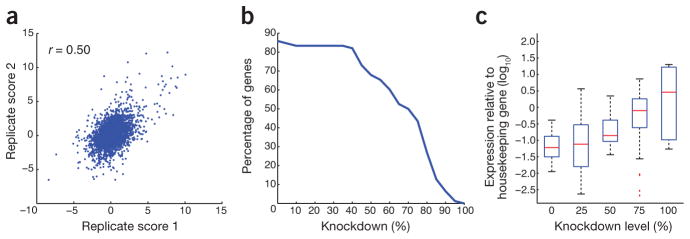
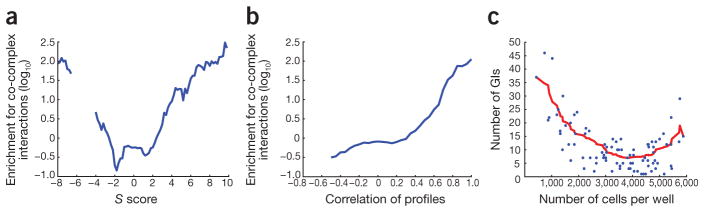
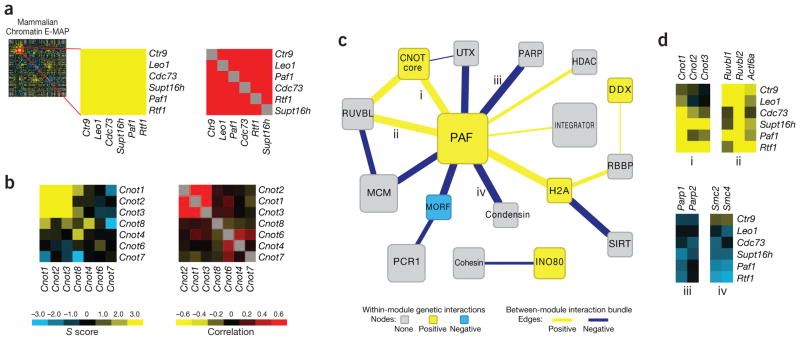
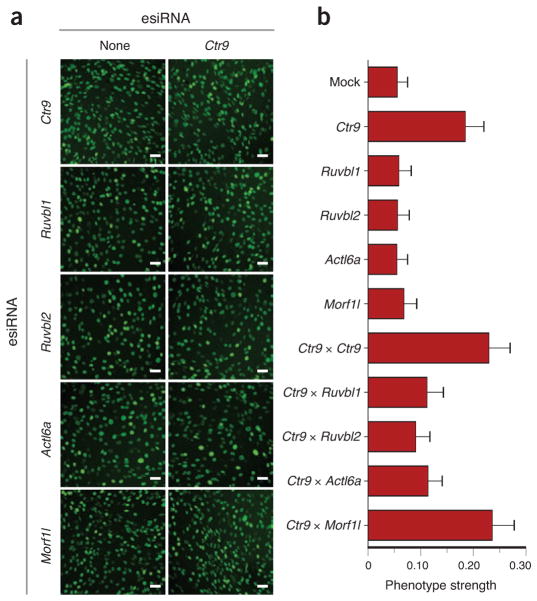
Mapping genetic interactions (GIs) by simultaneously perturbing pairs of genes is a powerful tool for understanding complex biological phenomena. Here we describe an experimental platform for generating quantitative GI maps in mammalian cells using a combinatorial RNA interference strategy. We performed ∼11,000 pairwise knockdowns in mouse fibroblasts, focusing on 130 factors involved in chromatin regulation to create a GI map. Comparison of the GI and protein-protein interaction (PPI) data revealed that pairs of genes exhibiting positive GIs and/or similar genetic profiles were predictive of the corresponding proteins being physically associated. The mammalian GI map identified pathways and complexes but also resolved functionally distinct submodules within larger protein complexes. By integrating GI and PPI data, we created a functional map of chromatin complexes in mouse fibroblasts, revealing that the PAF complex is a central player in the mammalian chromatin landscape.
Conflict of interest statement
The authors declare no competing financial interests.
Figures
Comment in
-
Scaling up the systematic hunt for mammalian genetic interactions.Nat Methods. 2013 May;10(5):397-9. doi: 10.1038/nmeth.2449. Nat Methods. 2013. PMID: 23629415 No abstract available.
-
Genetics: Mammalian genes interacting.Nat Methods. 2013 Apr;10(4):281. doi: 10.1038/nmeth.2424. Nat Methods. 2013. PMID: 23653921 No abstract available.
References
-
- Collins SR, et al. Functional dissection of protein complexes involved in yeast chromosome biology using a genetic interaction map. Nature. 2007;446:806–810. - PubMed
-
- Lehner B. Modelling genotype-phenotype relationships and human disease with genetic interaction networks. J Exp Biol. 2007;210:1559–1566. - PubMed
Publication types
MeSH terms
Substances
Grants and funding
- GM082250/GM/NIGMS NIH HHS/United States
- GM081879/GM/NIGMS NIH HHS/United States
- R01 GM085186/GM/NIGMS NIH HHS/United States
- P50 GM081879/GM/NIGMS NIH HHS/United States
- GM085186/GM/NIGMS NIH HHS/United States
- P50CA58207/CA/NCI NIH HHS/United States
- P50 GM082250/GM/NIGMS NIH HHS/United States
- P30 AI027763/AI/NIAID NIH HHS/United States
- AI091575/AI/NIAID NIH HHS/United States
- P01 AI091575/AI/NIAID NIH HHS/United States
- P01 AI090935/AI/NIAID NIH HHS/United States
- AI090935/AI/NIAID NIH HHS/United States
- P50 CA058207/CA/NCI NIH HHS/United States
LinkOut - more resources
Full Text Sources
Other Literature Sources
