

A systematic review of mathematical models of mosquito-borne pathogen transmission: 1970-2010
- PMID: 23407571
- PMCID: PMC3627099
- DOI: 10.1098/rsif.2012.0921
A systematic review of mathematical models of mosquito-borne pathogen transmission: 1970-2010
Abstract
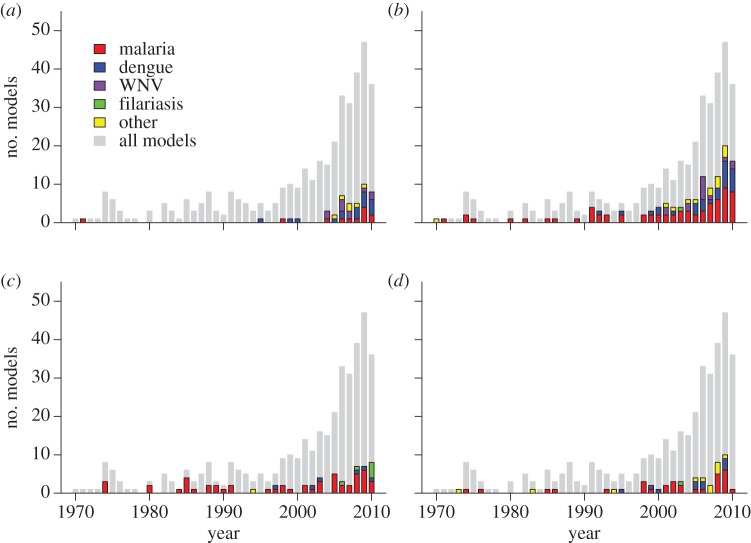
Mathematical models of mosquito-borne pathogen transmission originated in the early twentieth century to provide insights into how to most effectively combat malaria. The foundations of the Ross-Macdonald theory were established by 1970. Since then, there has been a growing interest in reducing the public health burden of mosquito-borne pathogens and an expanding use of models to guide their control. To assess how theory has changed to confront evolving public health challenges, we compiled a bibliography of 325 publications from 1970 through 2010 that included at least one mathematical model of mosquito-borne pathogen transmission and then used a 79-part questionnaire to classify each of 388 associated models according to its biological assumptions. As a composite measure to interpret the multidimensional results of our survey, we assigned a numerical value to each model that measured its similarity to 15 core assumptions of the Ross-Macdonald model. Although the analysis illustrated a growing acknowledgement of geographical, ecological and epidemiological complexities in modelling transmission, most models during the past 40 years closely resemble the Ross-Macdonald model. Modern theory would benefit from an expansion around the concepts of heterogeneous mosquito biting, poorly mixed mosquito-host encounters, spatial heterogeneity and temporal variation in the transmission process.
Figures


References
-
- Ross SR. 1908. Report on the prevention of malaria in Mauritius. London, UK: Waterlow & Sons Limited.
-
- Ross SR. 1911. The prevention of malaria. New York, NY: Dutton.
Publication types
MeSH terms
Grants and funding
- R01 AI069341/AI/NIAID NIH HHS/United States
- 095066/WT_/Wellcome Trust/United Kingdom
- R01 AI069387-01A1/AI/NIAID NIH HHS/United States
- R01-GM08322/GM/NIGMS NIH HHS/United States
- 5 U01 EH000418/EH/NCEH CDC HHS/United States
- U19AI089674/AI/NIAID NIH HHS/United States
- MR/K00669X/1/MRC_/Medical Research Council/United Kingdom
- U01 EH000418/EH/NCEH CDC HHS/United States
- R01-AI091980/AI/NIAID NIH HHS/United States
- T32 GM008322/GM/NIGMS NIH HHS/United States
- R01-AI069341/AI/NIAID NIH HHS/United States
- R01 AI069387/AI/NIAID NIH HHS/United States
- R01 AI091980/AI/NIAID NIH HHS/United States
- U19 AI089674/AI/NIAID NIH HHS/United States
LinkOut - more resources
Full Text Sources
Other Literature Sources
Medical
Research Materials
Miscellaneous