

Encoding of movement in near extrapersonal space in primate area VIP
- PMID: 23407621
- PMCID: PMC3570769
- DOI: 10.3389/fnbeh.2013.00008
Encoding of movement in near extrapersonal space in primate area VIP
Abstract
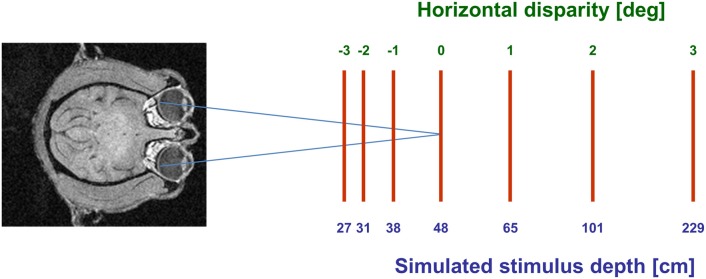
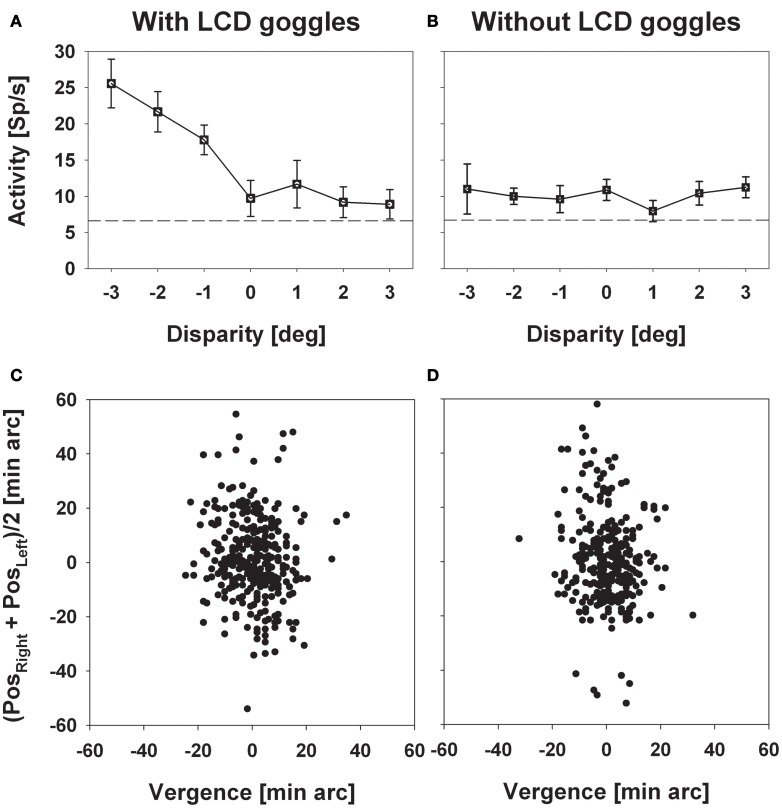
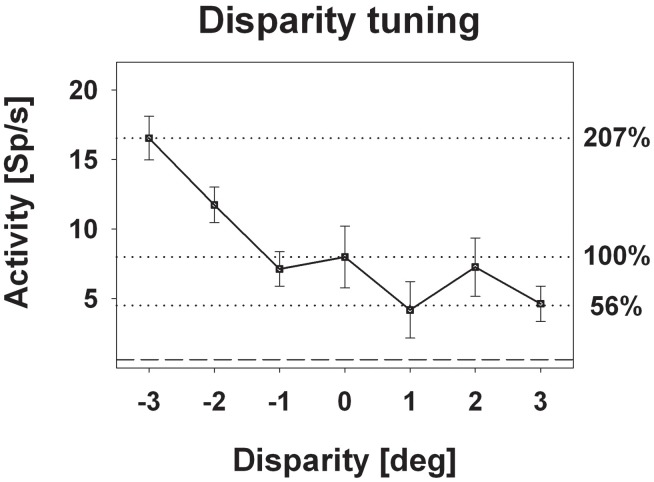
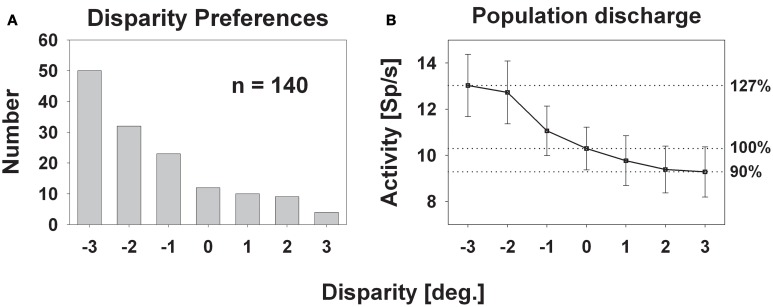
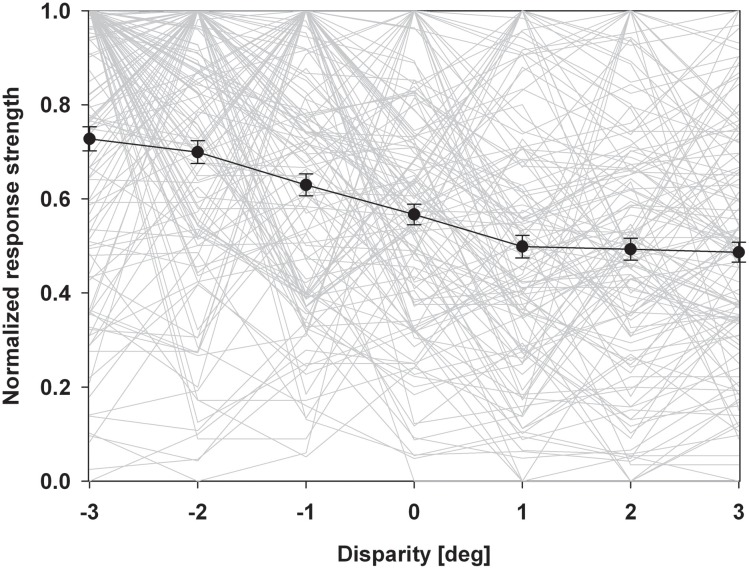
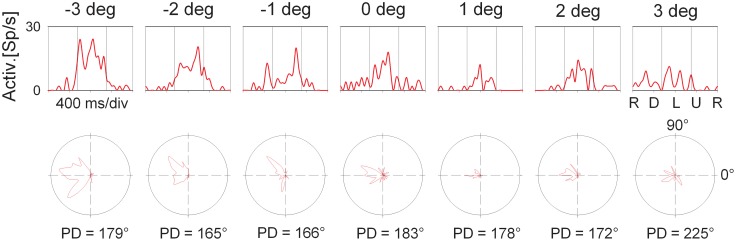
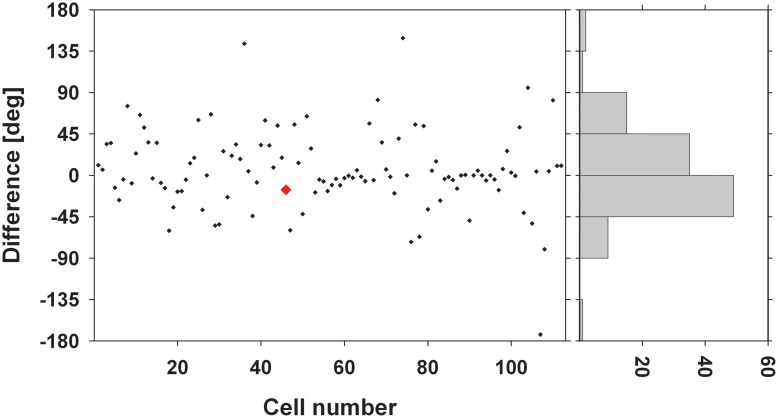
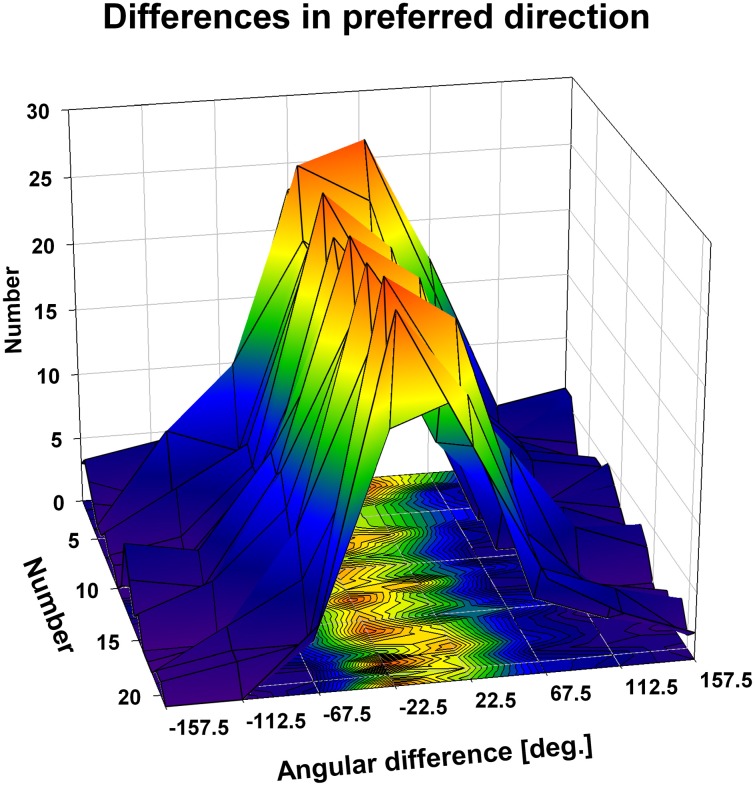
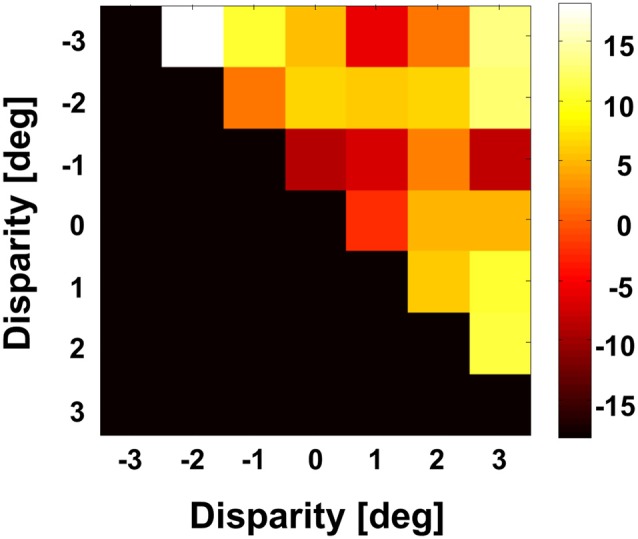
Many neurons in the macaque ventral intraparietal area (VIP) are multimodal, i.e., they respond not only to visual but also to tactile, auditory and vestibular stimulation. Anatomical studies have shown distinct projections between area VIP and a region of premotor cortex controlling head movements. A specific function of area VIP could be to guide movements in order to head for and/or to avoid objects in near extrapersonal space. This behavioral role would require a consistent representation of visual motion within 3-D space and enhanced activity for nearby motion signals. Accordingly, in our present study we investigated whether neurons in area VIP are sensitive to moving visual stimuli containing depth signals from horizontal disparity. We recorded single unit activity from area VIP of two awake behaving monkeys (Macaca mulatta) fixating a central target on a projection screen. Sensitivity of neurons to horizontal disparity was assessed by presenting large field moving images (random dot fields) stereoscopically to the two eyes by means of LCD shutter goggles synchronized with the stimulus computer. During an individual trial, stimuli had one of seven different disparity values ranging from 3° uncrossed- (far) to 3° crossed- (near) disparity in 1° steps. Stimuli moved at constant speed in all simulated depth planes. Different disparity values were presented across trials in pseudo-randomized order. Sixty-one percent of the motion sensitive cells had a statistically significant selectivity for the horizontal disparity of the stimulus (p < 0.05, distribution free ANOVA). Seventy-five percent of them preferred crossed-disparity values, i.e., moving stimuli in near space, with the highest mean activity for the nearest stimulus. At the population level, preferred direction of visual stimulus motion was not affected by horizontal disparity. Thus, our findings are in agreement with the behavioral role of area VIP in the representation of movement in near extrapersonal space.
Keywords: VIP; disparity; macaque monkey; multisensory; parietal cortex; self-motion.
Figures
Similar articles
-
Ventral intraparietal area of the macaque: anatomic location and visual response properties.J Neurophysiol. 1993 Mar;69(3):902-14. doi: 10.1152/jn.1993.69.3.902. J Neurophysiol. 1993. PMID: 8385201
-
Ventral intraparietal area of the macaque: congruent visual and somatic response properties.J Neurophysiol. 1998 Jan;79(1):126-36. doi: 10.1152/jn.1998.79.1.126. J Neurophysiol. 1998. PMID: 9425183
-
Disparity sensitivity of neurons in monkey extrastriate area MST.J Neurosci. 1992 Jul;12(7):2478-92. doi: 10.1523/JNEUROSCI.12-07-02478.1992. J Neurosci. 1992. PMID: 1613542 Free PMC article.
-
Mechanisms of stereopsis in monkey visual cortex.Cereb Cortex. 1995 May-Jun;5(3):193-204. doi: 10.1093/cercor/5.3.193. Cereb Cortex. 1995. PMID: 7613075 Review.
-
Multisensory space: from eye-movements to self-motion.J Physiol. 2011 Feb 15;589(Pt 4):815-23. doi: 10.1113/jphysiol.2010.195537. Epub 2010 Oct 4. J Physiol. 2011. PMID: 20921203 Free PMC article. Review.
Cited by
-
Parietal maps of visual signals for bodily action planning.Brain Struct Funct. 2021 Dec;226(9):2967-2988. doi: 10.1007/s00429-021-02378-6. Epub 2021 Sep 10. Brain Struct Funct. 2021. PMID: 34508272 Free PMC article. Review.
-
Clustering of heading selectivity and perception-related activity in the ventral intraparietal area.J Neurophysiol. 2018 Mar 1;119(3):1113-1126. doi: 10.1152/jn.00556.2017. Epub 2017 Nov 29. J Neurophysiol. 2018. PMID: 29187554 Free PMC article.
-
Multisensory maps in parietal cortex.Curr Opin Neurobiol. 2014 Feb;24(1):39-46. doi: 10.1016/j.conb.2013.08.014. Epub 2013 Oct 2. Curr Opin Neurobiol. 2014. PMID: 24492077 Free PMC article. Review.
-
The Role of Parieto-Occipital Junction in the Interaction between Dorsal and Ventral Streams in Disparity-Defined Near and Far Space Processing.PLoS One. 2016 Mar 21;11(3):e0151838. doi: 10.1371/journal.pone.0151838. eCollection 2016. PLoS One. 2016. PMID: 26999674 Free PMC article.
-
Evidence for a Causal Contribution of Macaque Vestibular, But Not Intraparietal, Cortex to Heading Perception.J Neurosci. 2016 Mar 30;36(13):3789-98. doi: 10.1523/JNEUROSCI.2485-15.2016. J Neurosci. 2016. PMID: 27030763 Free PMC article.
References
LinkOut - more resources
Full Text Sources
Other Literature Sources